Arapaho vs Immigrants from Laos Disability Age 5 to 17
COMPARE
Arapaho
Immigrants from Laos
Disability Age 5 to 17
Disability Age 5 to 17 Comparison
Arapaho
Immigrants from Laos
4.7%
DISABILITY AGE 5 TO 17
100.0/ 100
METRIC RATING
17th/ 347
METRIC RANK
5.8%
DISABILITY AGE 5 TO 17
3.8/ 100
METRIC RATING
232nd/ 347
METRIC RANK
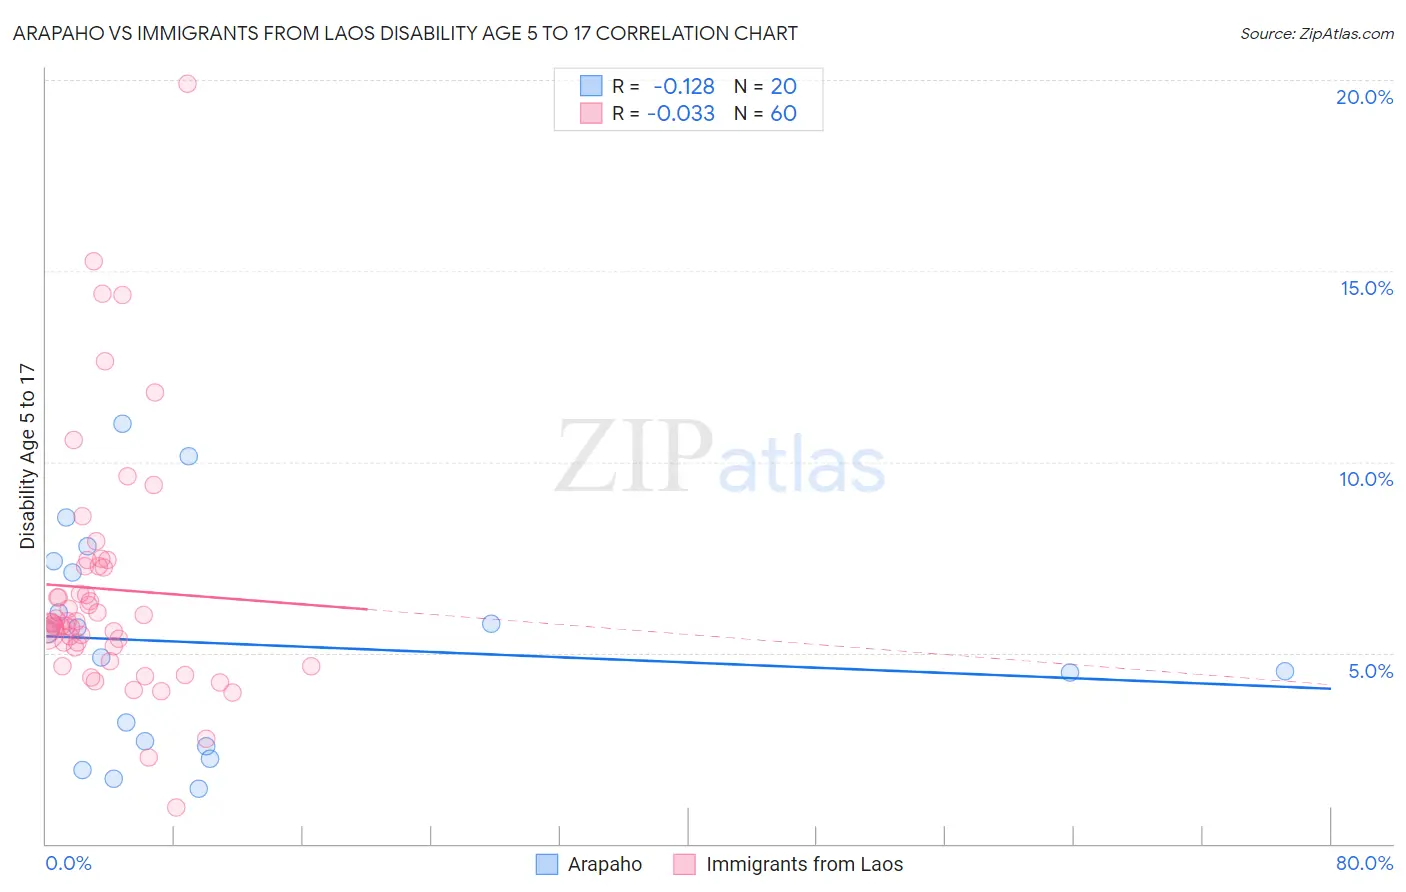
Arapaho vs Immigrants from Laos Disability Age 5 to 17 Correlation Chart
The statistical analysis conducted on geographies consisting of 29,737,383 people shows a poor negative correlation between the proportion of Arapaho and percentage of population with a disability between the ages 5 and 17 in the United States with a correlation coefficient (R) of -0.128 and weighted average of 4.7%. Similarly, the statistical analysis conducted on geographies consisting of 200,910,190 people shows no correlation between the proportion of Immigrants from Laos and percentage of population with a disability between the ages 5 and 17 in the United States with a correlation coefficient (R) of -0.033 and weighted average of 5.8%, a difference of 22.9%.
Disability Age 5 to 17 Correlation Summary
| Measurement | Arapaho | Immigrants from Laos |
| Minimum | 1.4% | 0.93% |
| Maximum | 11.0% | 19.9% |
| Range | 9.6% | 19.0% |
| Mean | 5.2% | 6.7% |
| Median | 5.2% | 5.8% |
| Interquartile 25% (IQ1) | 2.6% | 5.1% |
| Interquartile 75% (IQ3) | 7.3% | 7.3% |
| Interquartile Range (IQR) | 4.6% | 2.1% |
| Standard Deviation (Sample) | 2.8% | 3.3% |
| Standard Deviation (Population) | 2.7% | 3.2% |
Similar Demographics by Disability Age 5 to 17
Demographics Similar to Arapaho by Disability Age 5 to 17
In terms of disability age 5 to 17, the demographic groups most similar to Arapaho are Immigrants from South Central Asia (4.7%, a difference of 0.020%), Immigrants from Singapore (4.7%, a difference of 0.46%), Immigrants from Uzbekistan (4.8%, a difference of 0.51%), Chinese (4.7%, a difference of 0.88%), and Burmese (4.8%, a difference of 0.89%).
| Demographics | Rating | Rank | Disability Age 5 to 17 |
| Immigrants | India | 100.0 /100 | #10 | Exceptional 4.6% |
| Armenians | 100.0 /100 | #11 | Exceptional 4.6% |
| Iranians | 100.0 /100 | #12 | Exceptional 4.6% |
| Thais | 100.0 /100 | #13 | Exceptional 4.7% |
| Immigrants | Korea | 100.0 /100 | #14 | Exceptional 4.7% |
| Chinese | 100.0 /100 | #15 | Exceptional 4.7% |
| Immigrants | Singapore | 100.0 /100 | #16 | Exceptional 4.7% |
| Arapaho | 100.0 /100 | #17 | Exceptional 4.7% |
| Immigrants | South Central Asia | 100.0 /100 | #18 | Exceptional 4.7% |
| Immigrants | Uzbekistan | 100.0 /100 | #19 | Exceptional 4.8% |
| Burmese | 100.0 /100 | #20 | Exceptional 4.8% |
| Yup'ik | 100.0 /100 | #21 | Exceptional 4.8% |
| Asians | 100.0 /100 | #22 | Exceptional 4.8% |
| Immigrants | Bolivia | 100.0 /100 | #23 | Exceptional 4.8% |
| Immigrants | Lebanon | 100.0 /100 | #24 | Exceptional 4.8% |
Demographics Similar to Immigrants from Laos by Disability Age 5 to 17
In terms of disability age 5 to 17, the demographic groups most similar to Immigrants from Laos are Immigrants from West Indies (5.8%, a difference of 0.090%), Immigrants from Kenya (5.8%, a difference of 0.13%), Malaysian (5.8%, a difference of 0.14%), European (5.8%, a difference of 0.20%), and Immigrants from Brazil (5.8%, a difference of 0.20%).
| Demographics | Rating | Rank | Disability Age 5 to 17 |
| Guamanians/Chamorros | 5.6 /100 | #225 | Tragic 5.8% |
| British West Indians | 5.4 /100 | #226 | Tragic 5.8% |
| Swiss | 5.1 /100 | #227 | Tragic 5.8% |
| Haitians | 4.8 /100 | #228 | Tragic 5.8% |
| Bangladeshis | 4.8 /100 | #229 | Tragic 5.8% |
| Ghanaians | 4.7 /100 | #230 | Tragic 5.8% |
| Europeans | 4.5 /100 | #231 | Tragic 5.8% |
| Immigrants | Laos | 3.8 /100 | #232 | Tragic 5.8% |
| Immigrants | West Indies | 3.5 /100 | #233 | Tragic 5.8% |
| Immigrants | Kenya | 3.4 /100 | #234 | Tragic 5.8% |
| Malaysians | 3.4 /100 | #235 | Tragic 5.8% |
| Immigrants | Brazil | 3.2 /100 | #236 | Tragic 5.8% |
| Sudanese | 2.9 /100 | #237 | Tragic 5.8% |
| Hungarians | 2.6 /100 | #238 | Tragic 5.8% |
| German Russians | 2.4 /100 | #239 | Tragic 5.9% |