Immigrants from Russia vs Guamanian/Chamorro Disability Age Under 5
COMPARE
Immigrants from Russia
Guamanian/Chamorro
Disability Age Under 5
Disability Age Under 5 Comparison
Immigrants from Russia
Guamanians/Chamorros
1.1%
DISABILITY AGE UNDER 5
99.7/ 100
METRIC RATING
49th/ 347
METRIC RANK
1.2%
DISABILITY AGE UNDER 5
57.8/ 100
METRIC RATING
171st/ 347
METRIC RANK
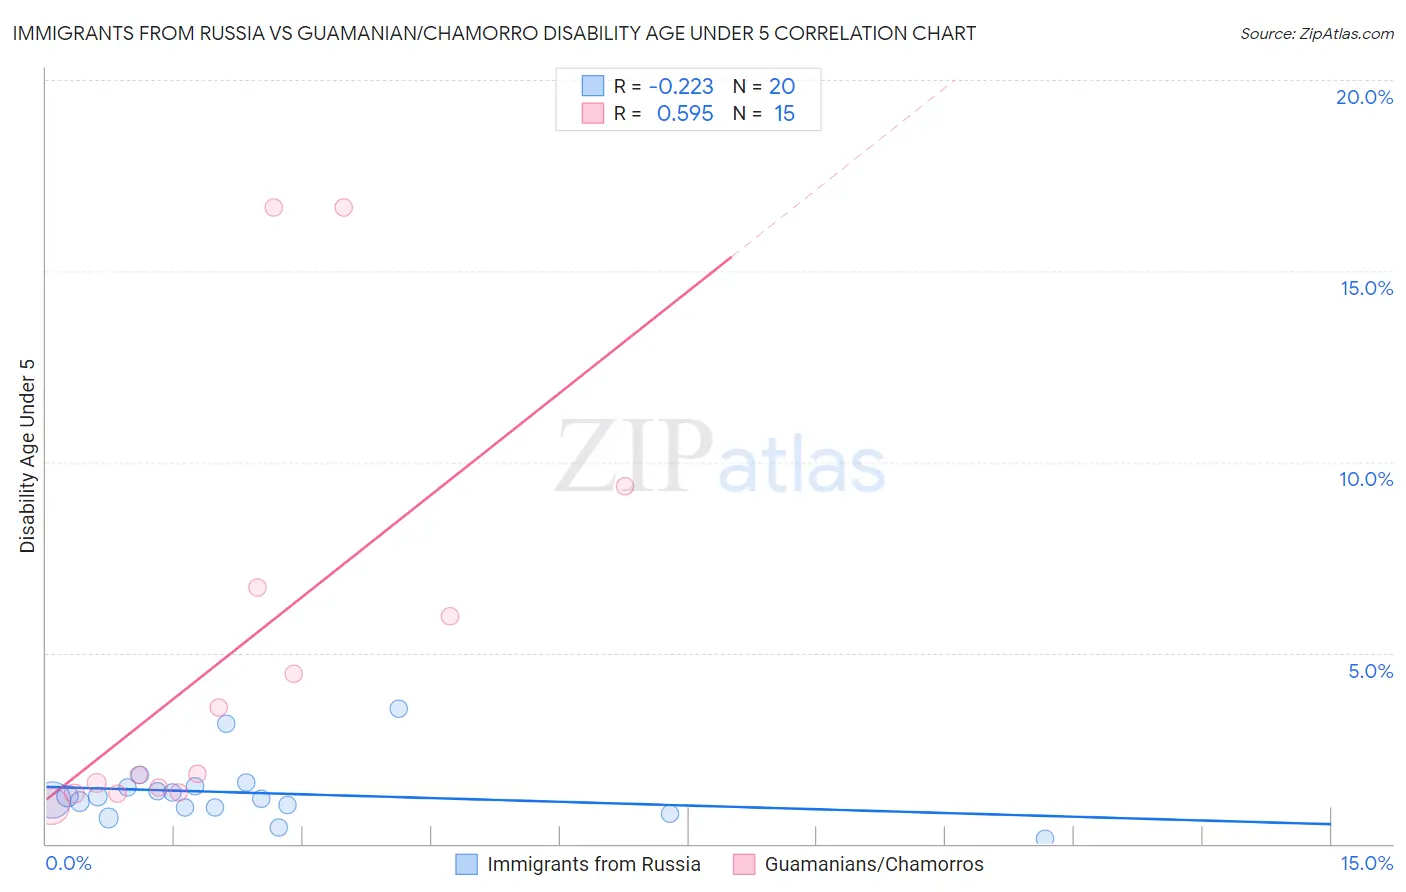
Immigrants from Russia vs Guamanian/Chamorro Disability Age Under 5 Correlation Chart
The statistical analysis conducted on geographies consisting of 192,972,084 people shows a weak negative correlation between the proportion of Immigrants from Russia and percentage of population with a disability under the age of 5 in the United States with a correlation coefficient (R) of -0.223 and weighted average of 1.1%. Similarly, the statistical analysis conducted on geographies consisting of 149,028,768 people shows a substantial positive correlation between the proportion of Guamanians/Chamorros and percentage of population with a disability under the age of 5 in the United States with a correlation coefficient (R) of 0.595 and weighted average of 1.2%, a difference of 14.5%.
Disability Age Under 5 Correlation Summary
| Measurement | Immigrants from Russia | Guamanian/Chamorro |
| Minimum | 0.14% | 0.97% |
| Maximum | 3.5% | 16.7% |
| Range | 3.4% | 15.7% |
| Mean | 1.3% | 5.0% |
| Median | 1.2% | 1.8% |
| Interquartile 25% (IQ1) | 0.95% | 1.4% |
| Interquartile 75% (IQ3) | 1.5% | 6.7% |
| Interquartile Range (IQR) | 0.53% | 5.3% |
| Standard Deviation (Sample) | 0.79% | 5.3% |
| Standard Deviation (Population) | 0.77% | 5.2% |
Similar Demographics by Disability Age Under 5
Demographics Similar to Immigrants from Russia by Disability Age Under 5
In terms of disability age under 5, the demographic groups most similar to Immigrants from Russia are Immigrants from Japan (1.1%, a difference of 0.020%), Immigrants from Kazakhstan (1.1%, a difference of 0.20%), Immigrants from Singapore (1.1%, a difference of 0.21%), Immigrants from Sweden (1.1%, a difference of 0.43%), and Immigrants from Congo (1.1%, a difference of 0.57%).
| Demographics | Rating | Rank | Disability Age Under 5 |
| Immigrants | Bulgaria | 99.8 /100 | #42 | Exceptional 1.1% |
| Pima | 99.8 /100 | #43 | Exceptional 1.1% |
| Immigrants | Asia | 99.8 /100 | #44 | Exceptional 1.1% |
| Immigrants | Turkey | 99.8 /100 | #45 | Exceptional 1.1% |
| Immigrants | Congo | 99.8 /100 | #46 | Exceptional 1.1% |
| Immigrants | Sweden | 99.8 /100 | #47 | Exceptional 1.1% |
| Immigrants | Singapore | 99.7 /100 | #48 | Exceptional 1.1% |
| Immigrants | Russia | 99.7 /100 | #49 | Exceptional 1.1% |
| Immigrants | Japan | 99.7 /100 | #50 | Exceptional 1.1% |
| Immigrants | Kazakhstan | 99.7 /100 | #51 | Exceptional 1.1% |
| Immigrants | Bolivia | 99.6 /100 | #52 | Exceptional 1.1% |
| Asians | 99.6 /100 | #53 | Exceptional 1.1% |
| Immigrants | El Salvador | 99.6 /100 | #54 | Exceptional 1.1% |
| Salvadorans | 99.5 /100 | #55 | Exceptional 1.1% |
| Ecuadorians | 99.5 /100 | #56 | Exceptional 1.1% |
Demographics Similar to Guamanians/Chamorros by Disability Age Under 5
In terms of disability age under 5, the demographic groups most similar to Guamanians/Chamorros are Immigrants from Jamaica (1.2%, a difference of 0.090%), Immigrants from Uruguay (1.2%, a difference of 0.11%), Sierra Leonean (1.2%, a difference of 0.12%), Immigrants from Argentina (1.2%, a difference of 0.23%), and Immigrants from Central America (1.2%, a difference of 0.34%).
| Demographics | Rating | Rank | Disability Age Under 5 |
| Laotians | 62.8 /100 | #164 | Good 1.2% |
| Immigrants | Kuwait | 62.6 /100 | #165 | Good 1.2% |
| Immigrants | Central America | 61.4 /100 | #166 | Good 1.2% |
| Immigrants | Argentina | 60.2 /100 | #167 | Good 1.2% |
| Sierra Leoneans | 59.1 /100 | #168 | Average 1.2% |
| Immigrants | Uruguay | 59.0 /100 | #169 | Average 1.2% |
| Immigrants | Jamaica | 58.8 /100 | #170 | Average 1.2% |
| Guamanians/Chamorros | 57.8 /100 | #171 | Average 1.2% |
| Crow | 51.0 /100 | #172 | Average 1.2% |
| Immigrants | Ireland | 50.3 /100 | #173 | Average 1.2% |
| Immigrants | Latvia | 50.0 /100 | #174 | Average 1.2% |
| Immigrants | Nigeria | 50.0 /100 | #175 | Average 1.2% |
| Immigrants | Kenya | 48.6 /100 | #176 | Average 1.2% |
| Comanche | 47.5 /100 | #177 | Average 1.2% |
| Venezuelans | 47.1 /100 | #178 | Average 1.2% |