Immigrants from Russia vs Turkish Hearing Disability
COMPARE
Immigrants from Russia
Turkish
Hearing Disability
Hearing Disability Comparison
Immigrants from Russia
Turks
2.9%
HEARING DISABILITY
77.7/ 100
METRIC RATING
148th/ 347
METRIC RANK
2.8%
HEARING DISABILITY
93.0/ 100
METRIC RATING
109th/ 347
METRIC RANK
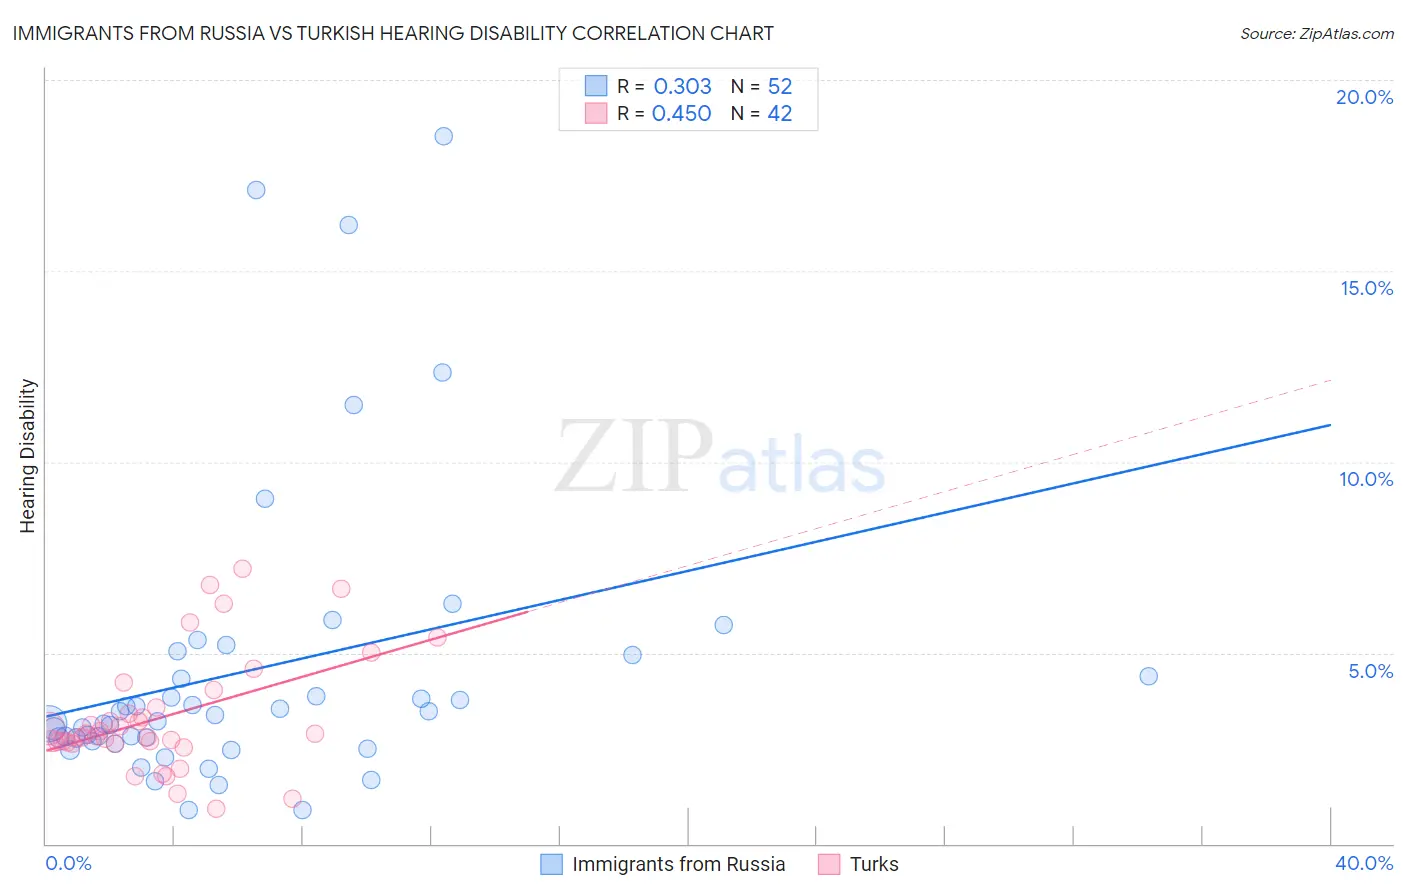
Immigrants from Russia vs Turkish Hearing Disability Correlation Chart
The statistical analysis conducted on geographies consisting of 347,834,739 people shows a mild positive correlation between the proportion of Immigrants from Russia and percentage of population with hearing disability in the United States with a correlation coefficient (R) of 0.303 and weighted average of 2.9%. Similarly, the statistical analysis conducted on geographies consisting of 271,814,668 people shows a moderate positive correlation between the proportion of Turks and percentage of population with hearing disability in the United States with a correlation coefficient (R) of 0.450 and weighted average of 2.8%, a difference of 3.4%.
Hearing Disability Correlation Summary
| Measurement | Immigrants from Russia | Turkish |
| Minimum | 0.87% | 0.92% |
| Maximum | 18.5% | 7.2% |
| Range | 17.7% | 6.3% |
| Mean | 4.5% | 3.3% |
| Median | 3.3% | 2.9% |
| Interquartile 25% (IQ1) | 2.7% | 2.7% |
| Interquartile 75% (IQ3) | 4.7% | 3.6% |
| Interquartile Range (IQR) | 1.9% | 0.93% |
| Standard Deviation (Sample) | 3.9% | 1.5% |
| Standard Deviation (Population) | 3.8% | 1.5% |
Similar Demographics by Hearing Disability
Demographics Similar to Immigrants from Russia by Hearing Disability
In terms of hearing disability, the demographic groups most similar to Immigrants from Russia are Immigrants from Panama (2.9%, a difference of 0.11%), Tongan (2.9%, a difference of 0.13%), Brazilian (2.9%, a difference of 0.15%), Immigrants from Congo (2.9%, a difference of 0.17%), and Immigrants from Bulgaria (2.9%, a difference of 0.21%).
| Demographics | Rating | Rank | Hearing Disability |
| Sub-Saharan Africans | 83.3 /100 | #141 | Excellent 2.9% |
| Laotians | 81.1 /100 | #142 | Excellent 2.9% |
| Immigrants | Bahamas | 80.9 /100 | #143 | Excellent 2.9% |
| Immigrants | Bulgaria | 79.2 /100 | #144 | Good 2.9% |
| Immigrants | Congo | 78.9 /100 | #145 | Good 2.9% |
| Brazilians | 78.7 /100 | #146 | Good 2.9% |
| Tongans | 78.6 /100 | #147 | Good 2.9% |
| Immigrants | Russia | 77.7 /100 | #148 | Good 2.9% |
| Immigrants | Panama | 76.9 /100 | #149 | Good 2.9% |
| Palestinians | 73.6 /100 | #150 | Good 2.9% |
| Immigrants | France | 73.1 /100 | #151 | Good 2.9% |
| Immigrants | Lithuania | 73.0 /100 | #152 | Good 2.9% |
| Sudanese | 72.1 /100 | #153 | Good 2.9% |
| Immigrants | Lebanon | 71.5 /100 | #154 | Good 2.9% |
| Costa Ricans | 71.4 /100 | #155 | Good 2.9% |
Demographics Similar to Turks by Hearing Disability
In terms of hearing disability, the demographic groups most similar to Turks are Cypriot (2.8%, a difference of 0.050%), Guatemalan (2.8%, a difference of 0.070%), Immigrants from Yemen (2.8%, a difference of 0.10%), Honduran (2.8%, a difference of 0.15%), and Immigrants from Chile (2.8%, a difference of 0.15%).
| Demographics | Rating | Rank | Hearing Disability |
| Taiwanese | 94.8 /100 | #102 | Exceptional 2.8% |
| Immigrants | Indonesia | 94.7 /100 | #103 | Exceptional 2.8% |
| Burmese | 94.2 /100 | #104 | Exceptional 2.8% |
| Moroccans | 93.9 /100 | #105 | Exceptional 2.8% |
| Hondurans | 93.4 /100 | #106 | Exceptional 2.8% |
| Immigrants | Chile | 93.4 /100 | #107 | Exceptional 2.8% |
| Guatemalans | 93.2 /100 | #108 | Exceptional 2.8% |
| Turks | 93.0 /100 | #109 | Exceptional 2.8% |
| Cypriots | 92.9 /100 | #110 | Exceptional 2.8% |
| Immigrants | Yemen | 92.7 /100 | #111 | Exceptional 2.8% |
| U.S. Virgin Islanders | 92.5 /100 | #112 | Exceptional 2.8% |
| Immigrants | Belarus | 91.6 /100 | #113 | Exceptional 2.8% |
| Cambodians | 91.1 /100 | #114 | Exceptional 2.8% |
| Immigrants | Latin America | 90.5 /100 | #115 | Exceptional 2.8% |
| Immigrants | Immigrants | 90.3 /100 | #116 | Exceptional 2.8% |