Immigrants from Russia vs Puerto Rican Hearing Disability
COMPARE
Immigrants from Russia
Puerto Rican
Hearing Disability
Hearing Disability Comparison
Immigrants from Russia
Puerto Ricans
2.9%
HEARING DISABILITY
77.7/ 100
METRIC RATING
148th/ 347
METRIC RANK
3.5%
HEARING DISABILITY
0.0/ 100
METRIC RATING
273rd/ 347
METRIC RANK
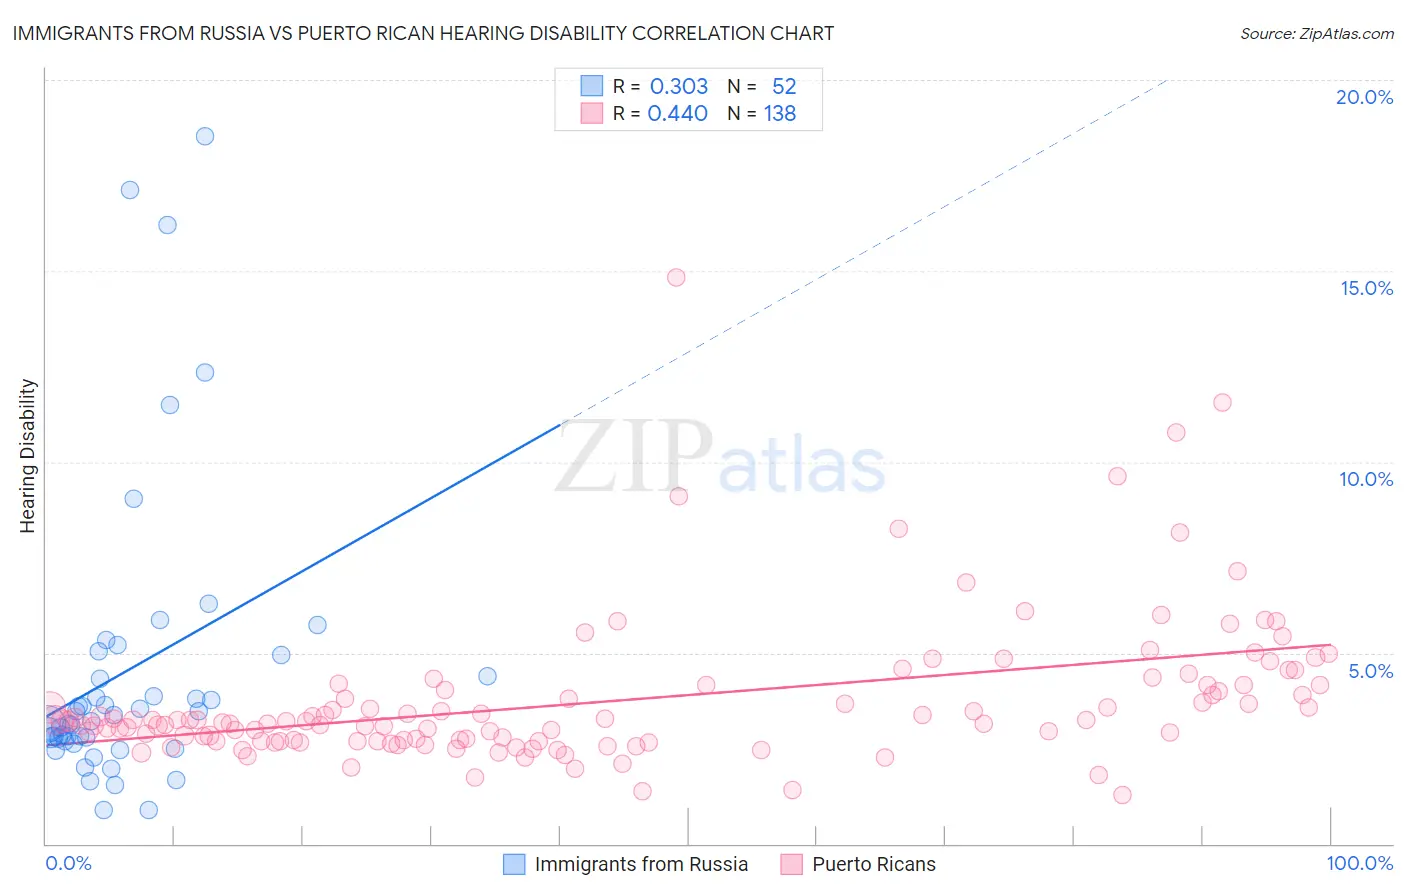
Immigrants from Russia vs Puerto Rican Hearing Disability Correlation Chart
The statistical analysis conducted on geographies consisting of 347,834,739 people shows a mild positive correlation between the proportion of Immigrants from Russia and percentage of population with hearing disability in the United States with a correlation coefficient (R) of 0.303 and weighted average of 2.9%. Similarly, the statistical analysis conducted on geographies consisting of 527,769,112 people shows a moderate positive correlation between the proportion of Puerto Ricans and percentage of population with hearing disability in the United States with a correlation coefficient (R) of 0.440 and weighted average of 3.5%, a difference of 21.5%.
Hearing Disability Correlation Summary
| Measurement | Immigrants from Russia | Puerto Rican |
| Minimum | 0.87% | 1.3% |
| Maximum | 18.5% | 14.8% |
| Range | 17.7% | 13.5% |
| Mean | 4.5% | 3.7% |
| Median | 3.3% | 3.2% |
| Interquartile 25% (IQ1) | 2.7% | 2.7% |
| Interquartile 75% (IQ3) | 4.7% | 4.1% |
| Interquartile Range (IQR) | 1.9% | 1.4% |
| Standard Deviation (Sample) | 3.9% | 1.9% |
| Standard Deviation (Population) | 3.8% | 1.9% |
Similar Demographics by Hearing Disability
Demographics Similar to Immigrants from Russia by Hearing Disability
In terms of hearing disability, the demographic groups most similar to Immigrants from Russia are Immigrants from Panama (2.9%, a difference of 0.11%), Tongan (2.9%, a difference of 0.13%), Brazilian (2.9%, a difference of 0.15%), Immigrants from Congo (2.9%, a difference of 0.17%), and Immigrants from Bulgaria (2.9%, a difference of 0.21%).
| Demographics | Rating | Rank | Hearing Disability |
| Sub-Saharan Africans | 83.3 /100 | #141 | Excellent 2.9% |
| Laotians | 81.1 /100 | #142 | Excellent 2.9% |
| Immigrants | Bahamas | 80.9 /100 | #143 | Excellent 2.9% |
| Immigrants | Bulgaria | 79.2 /100 | #144 | Good 2.9% |
| Immigrants | Congo | 78.9 /100 | #145 | Good 2.9% |
| Brazilians | 78.7 /100 | #146 | Good 2.9% |
| Tongans | 78.6 /100 | #147 | Good 2.9% |
| Immigrants | Russia | 77.7 /100 | #148 | Good 2.9% |
| Immigrants | Panama | 76.9 /100 | #149 | Good 2.9% |
| Palestinians | 73.6 /100 | #150 | Good 2.9% |
| Immigrants | France | 73.1 /100 | #151 | Good 2.9% |
| Immigrants | Lithuania | 73.0 /100 | #152 | Good 2.9% |
| Sudanese | 72.1 /100 | #153 | Good 2.9% |
| Immigrants | Lebanon | 71.5 /100 | #154 | Good 2.9% |
| Costa Ricans | 71.4 /100 | #155 | Good 2.9% |
Demographics Similar to Puerto Ricans by Hearing Disability
In terms of hearing disability, the demographic groups most similar to Puerto Ricans are Fijian (3.5%, a difference of 0.070%), Swiss (3.5%, a difference of 0.32%), Czech (3.5%, a difference of 0.33%), Czechoslovakian (3.6%, a difference of 0.53%), and European (3.5%, a difference of 0.59%).
| Demographics | Rating | Rank | Hearing Disability |
| Belgians | 0.1 /100 | #266 | Tragic 3.5% |
| Canadians | 0.1 /100 | #267 | Tragic 3.5% |
| Spaniards | 0.1 /100 | #268 | Tragic 3.5% |
| Ute | 0.1 /100 | #269 | Tragic 3.5% |
| Europeans | 0.1 /100 | #270 | Tragic 3.5% |
| Czechs | 0.1 /100 | #271 | Tragic 3.5% |
| Fijians | 0.0 /100 | #272 | Tragic 3.5% |
| Puerto Ricans | 0.0 /100 | #273 | Tragic 3.5% |
| Swiss | 0.0 /100 | #274 | Tragic 3.5% |
| Czechoslovakians | 0.0 /100 | #275 | Tragic 3.6% |
| Danes | 0.0 /100 | #276 | Tragic 3.6% |
| Immigrants | Nonimmigrants | 0.0 /100 | #277 | Tragic 3.6% |
| Basques | 0.0 /100 | #278 | Tragic 3.6% |
| Slovaks | 0.0 /100 | #279 | Tragic 3.6% |
| French American Indians | 0.0 /100 | #280 | Tragic 3.6% |