Eastern European vs Thai Hearing Disability
COMPARE
Eastern European
Thai
Hearing Disability
Hearing Disability Comparison
Eastern Europeans
Thais
3.1%
HEARING DISABILITY
15.5/ 100
METRIC RATING
206th/ 347
METRIC RANK
2.5%
HEARING DISABILITY
99.8/ 100
METRIC RATING
19th/ 347
METRIC RANK
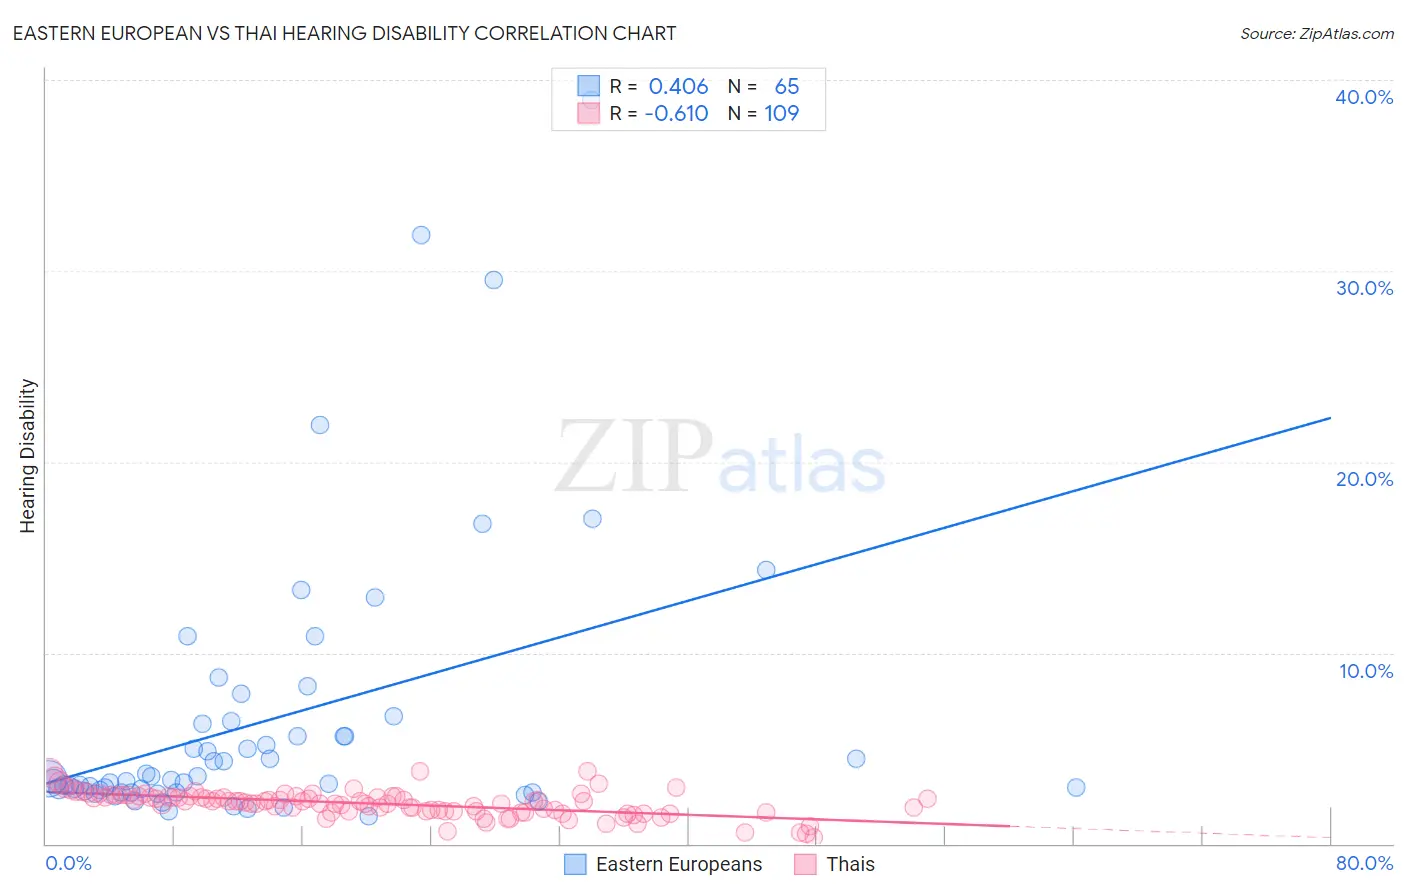
Eastern European vs Thai Hearing Disability Correlation Chart
The statistical analysis conducted on geographies consisting of 461,059,172 people shows a moderate positive correlation between the proportion of Eastern Europeans and percentage of population with hearing disability in the United States with a correlation coefficient (R) of 0.406 and weighted average of 3.1%. Similarly, the statistical analysis conducted on geographies consisting of 475,566,624 people shows a significant negative correlation between the proportion of Thais and percentage of population with hearing disability in the United States with a correlation coefficient (R) of -0.610 and weighted average of 2.5%, a difference of 22.3%.
Hearing Disability Correlation Summary
| Measurement | Eastern European | Thai |
| Minimum | 1.4% | 0.30% |
| Maximum | 39.0% | 3.8% |
| Range | 37.5% | 3.5% |
| Mean | 6.5% | 2.1% |
| Median | 3.4% | 2.2% |
| Interquartile 25% (IQ1) | 2.7% | 1.7% |
| Interquartile 75% (IQ3) | 6.4% | 2.5% |
| Interquartile Range (IQR) | 3.6% | 0.79% |
| Standard Deviation (Sample) | 7.3% | 0.65% |
| Standard Deviation (Population) | 7.3% | 0.65% |
Similar Demographics by Hearing Disability
Demographics Similar to Eastern Europeans by Hearing Disability
In terms of hearing disability, the demographic groups most similar to Eastern Europeans are Immigrants from Czechoslovakia (3.1%, a difference of 0.070%), Alsatian (3.1%, a difference of 0.070%), Hispanic or Latino (3.1%, a difference of 0.070%), Immigrants from Denmark (3.1%, a difference of 0.12%), and Immigrants from Thailand (3.1%, a difference of 0.16%).
| Demographics | Rating | Rank | Hearing Disability |
| Syrians | 19.2 /100 | #199 | Poor 3.1% |
| Immigrants | North Macedonia | 19.1 /100 | #200 | Poor 3.1% |
| Iraqis | 19.0 /100 | #201 | Poor 3.1% |
| Immigrants | Thailand | 16.4 /100 | #202 | Poor 3.1% |
| Immigrants | Denmark | 16.2 /100 | #203 | Poor 3.1% |
| Immigrants | Czechoslovakia | 15.9 /100 | #204 | Poor 3.1% |
| Alsatians | 15.9 /100 | #205 | Poor 3.1% |
| Eastern Europeans | 15.5 /100 | #206 | Poor 3.1% |
| Hispanics or Latinos | 15.1 /100 | #207 | Poor 3.1% |
| Immigrants | Latvia | 12.7 /100 | #208 | Poor 3.1% |
| Immigrants | Hungary | 12.5 /100 | #209 | Poor 3.1% |
| Cape Verdeans | 12.2 /100 | #210 | Poor 3.1% |
| Romanians | 12.1 /100 | #211 | Poor 3.1% |
| Pakistanis | 11.1 /100 | #212 | Poor 3.1% |
| Immigrants | Iraq | 10.5 /100 | #213 | Poor 3.1% |
Demographics Similar to Thais by Hearing Disability
In terms of hearing disability, the demographic groups most similar to Thais are Dominican (2.5%, a difference of 0.030%), Immigrants from Bolivia (2.5%, a difference of 0.050%), Ghanaian (2.5%, a difference of 0.11%), Immigrants from Sierra Leone (2.6%, a difference of 0.16%), and Immigrants from Nigeria (2.6%, a difference of 0.65%).
| Demographics | Rating | Rank | Hearing Disability |
| Trinidadians and Tobagonians | 99.9 /100 | #12 | Exceptional 2.5% |
| Sierra Leoneans | 99.9 /100 | #13 | Exceptional 2.5% |
| Ecuadorians | 99.9 /100 | #14 | Exceptional 2.5% |
| Barbadians | 99.9 /100 | #15 | Exceptional 2.5% |
| Immigrants | West Indies | 99.9 /100 | #16 | Exceptional 2.5% |
| Immigrants | India | 99.9 /100 | #17 | Exceptional 2.5% |
| Dominicans | 99.8 /100 | #18 | Exceptional 2.5% |
| Thais | 99.8 /100 | #19 | Exceptional 2.5% |
| Immigrants | Bolivia | 99.8 /100 | #20 | Exceptional 2.5% |
| Ghanaians | 99.8 /100 | #21 | Exceptional 2.5% |
| Immigrants | Sierra Leone | 99.8 /100 | #22 | Exceptional 2.6% |
| Immigrants | Nigeria | 99.8 /100 | #23 | Exceptional 2.6% |
| Immigrants | Ghana | 99.8 /100 | #24 | Exceptional 2.6% |
| Immigrants | El Salvador | 99.7 /100 | #25 | Exceptional 2.6% |
| Immigrants | Senegal | 99.7 /100 | #26 | Exceptional 2.6% |