Immigrants from Romania vs Spanish Hearing Disability
COMPARE
Immigrants from Romania
Spanish
Hearing Disability
Hearing Disability Comparison
Immigrants from Romania
Spanish
3.0%
HEARING DISABILITY
48.4/ 100
METRIC RATING
175th/ 347
METRIC RANK
3.7%
HEARING DISABILITY
0.0/ 100
METRIC RATING
287th/ 347
METRIC RANK
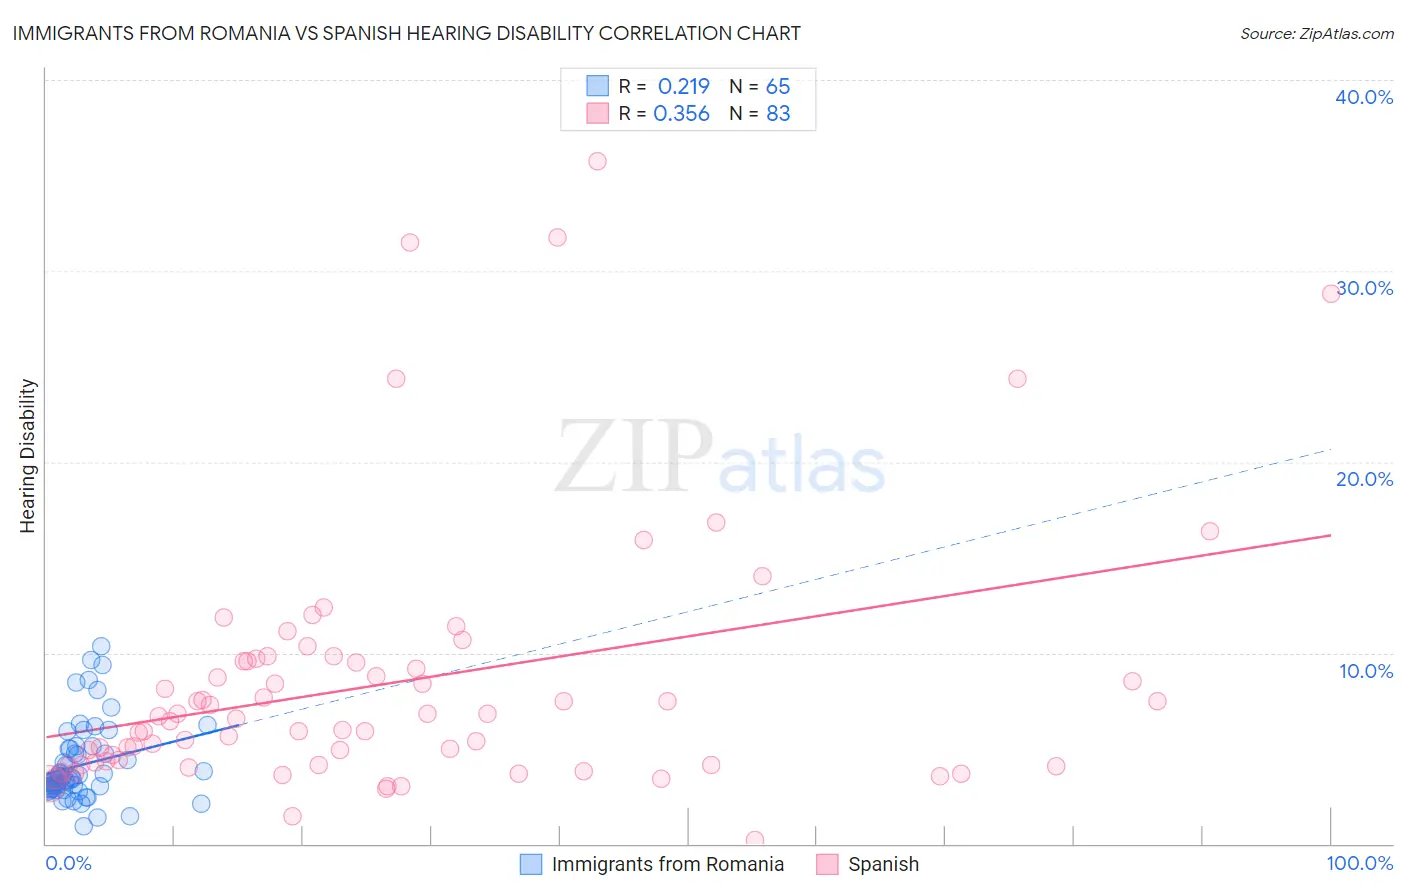
Immigrants from Romania vs Spanish Hearing Disability Correlation Chart
The statistical analysis conducted on geographies consisting of 256,976,190 people shows a weak positive correlation between the proportion of Immigrants from Romania and percentage of population with hearing disability in the United States with a correlation coefficient (R) of 0.219 and weighted average of 3.0%. Similarly, the statistical analysis conducted on geographies consisting of 421,995,316 people shows a mild positive correlation between the proportion of Spanish and percentage of population with hearing disability in the United States with a correlation coefficient (R) of 0.356 and weighted average of 3.7%, a difference of 21.7%.
Hearing Disability Correlation Summary
| Measurement | Immigrants from Romania | Spanish |
| Minimum | 0.93% | 0.21% |
| Maximum | 10.3% | 35.7% |
| Range | 9.4% | 35.5% |
| Mean | 4.1% | 8.4% |
| Median | 3.4% | 6.5% |
| Interquartile 25% (IQ1) | 2.9% | 4.1% |
| Interquartile 75% (IQ3) | 5.0% | 9.6% |
| Interquartile Range (IQR) | 2.1% | 5.5% |
| Standard Deviation (Sample) | 2.0% | 6.8% |
| Standard Deviation (Population) | 2.0% | 6.8% |
Similar Demographics by Hearing Disability
Demographics Similar to Immigrants from Romania by Hearing Disability
In terms of hearing disability, the demographic groups most similar to Immigrants from Romania are Panamanian (3.0%, a difference of 0.14%), Indonesian (3.0%, a difference of 0.15%), Immigrants from Philippines (3.0%, a difference of 0.20%), Japanese (3.0%, a difference of 0.23%), and Immigrants from Serbia (3.0%, a difference of 0.25%).
| Demographics | Rating | Rank | Hearing Disability |
| Immigrants | Greece | 57.9 /100 | #168 | Average 3.0% |
| Arabs | 57.6 /100 | #169 | Average 3.0% |
| Immigrants | Cabo Verde | 56.9 /100 | #170 | Average 3.0% |
| Immigrants | Ukraine | 56.6 /100 | #171 | Average 3.0% |
| Armenians | 56.0 /100 | #172 | Average 3.0% |
| Immigrants | Serbia | 51.1 /100 | #173 | Average 3.0% |
| Indonesians | 50.0 /100 | #174 | Average 3.0% |
| Immigrants | Romania | 48.4 /100 | #175 | Average 3.0% |
| Panamanians | 47.0 /100 | #176 | Average 3.0% |
| Immigrants | Philippines | 46.4 /100 | #177 | Average 3.0% |
| Japanese | 46.0 /100 | #178 | Average 3.0% |
| Immigrants | Moldova | 43.1 /100 | #179 | Average 3.0% |
| Immigrants | Sweden | 42.4 /100 | #180 | Average 3.0% |
| Immigrants | Belgium | 41.5 /100 | #181 | Average 3.0% |
| Immigrants | Italy | 41.1 /100 | #182 | Average 3.0% |
Demographics Similar to Spanish by Hearing Disability
In terms of hearing disability, the demographic groups most similar to Spanish are Delaware (3.6%, a difference of 0.24%), Sioux (3.6%, a difference of 0.28%), Immigrants from Micronesia (3.6%, a difference of 0.38%), Irish (3.7%, a difference of 0.57%), and Chinese (3.7%, a difference of 0.78%).
| Demographics | Rating | Rank | Hearing Disability |
| French American Indians | 0.0 /100 | #280 | Tragic 3.6% |
| Scandinavians | 0.0 /100 | #281 | Tragic 3.6% |
| Swedes | 0.0 /100 | #282 | Tragic 3.6% |
| Blackfeet | 0.0 /100 | #283 | Tragic 3.6% |
| Immigrants | Micronesia | 0.0 /100 | #284 | Tragic 3.6% |
| Sioux | 0.0 /100 | #285 | Tragic 3.6% |
| Delaware | 0.0 /100 | #286 | Tragic 3.6% |
| Spanish | 0.0 /100 | #287 | Tragic 3.7% |
| Irish | 0.0 /100 | #288 | Tragic 3.7% |
| Chinese | 0.0 /100 | #289 | Tragic 3.7% |
| Whites/Caucasians | 0.0 /100 | #290 | Tragic 3.7% |
| Finns | 0.0 /100 | #291 | Tragic 3.7% |
| Native Hawaiians | 0.0 /100 | #292 | Tragic 3.7% |
| Norwegians | 0.0 /100 | #293 | Tragic 3.7% |
| Iroquois | 0.0 /100 | #294 | Tragic 3.7% |