Italian vs Thai Hearing Disability
COMPARE
Italian
Thai
Hearing Disability
Hearing Disability Comparison
Italians
Thais
3.4%
HEARING DISABILITY
0.4/ 100
METRIC RATING
249th/ 347
METRIC RANK
2.5%
HEARING DISABILITY
99.8/ 100
METRIC RATING
19th/ 347
METRIC RANK
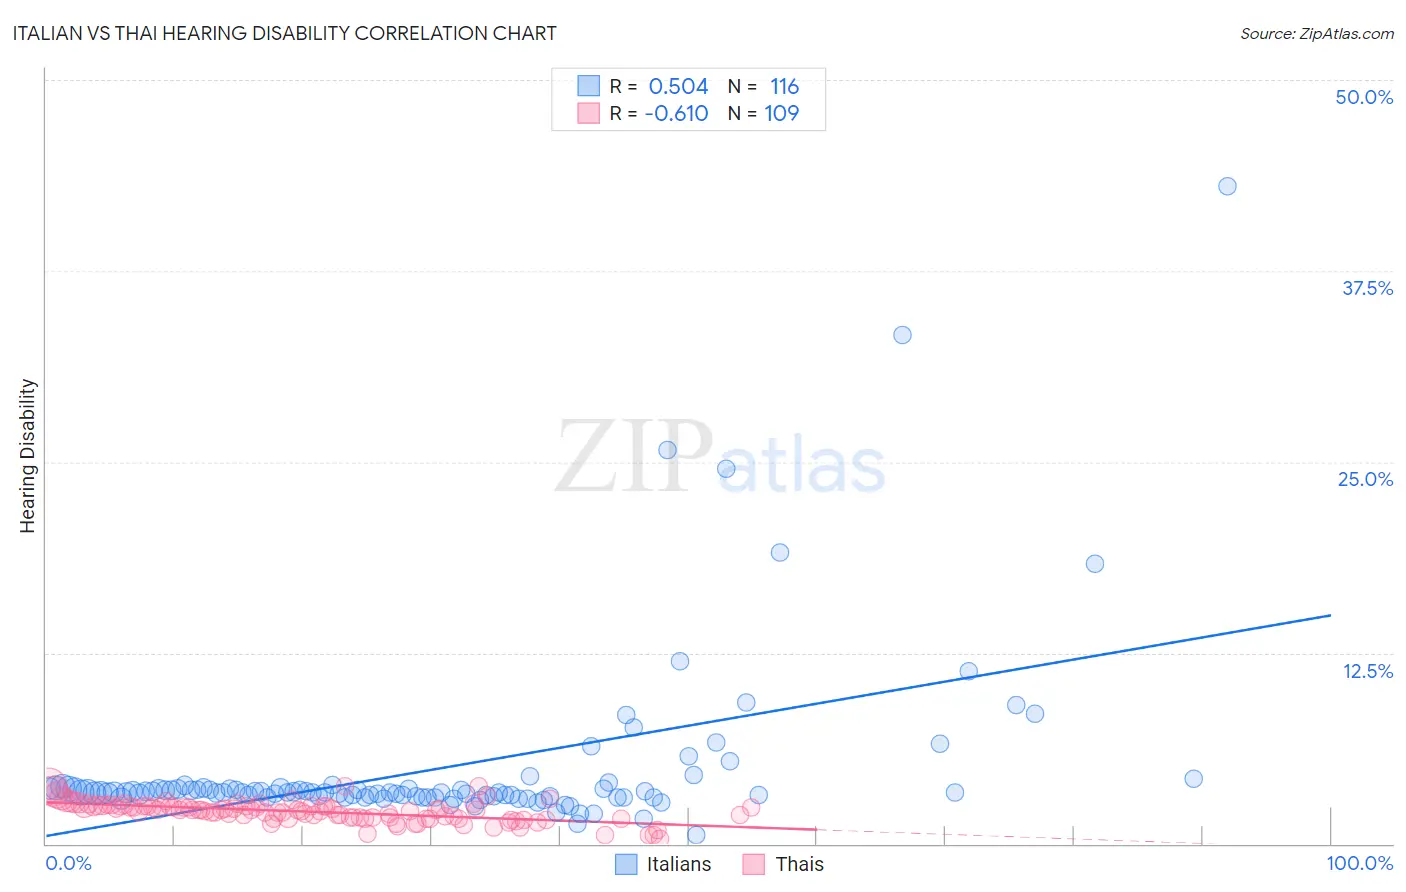
Italian vs Thai Hearing Disability Correlation Chart
The statistical analysis conducted on geographies consisting of 574,261,406 people shows a substantial positive correlation between the proportion of Italians and percentage of population with hearing disability in the United States with a correlation coefficient (R) of 0.504 and weighted average of 3.4%. Similarly, the statistical analysis conducted on geographies consisting of 475,566,624 people shows a significant negative correlation between the proportion of Thais and percentage of population with hearing disability in the United States with a correlation coefficient (R) of -0.610 and weighted average of 2.5%, a difference of 32.6%.
Hearing Disability Correlation Summary
| Measurement | Italian | Thai |
| Minimum | 0.61% | 0.30% |
| Maximum | 43.0% | 3.8% |
| Range | 42.4% | 3.5% |
| Mean | 5.0% | 2.1% |
| Median | 3.4% | 2.2% |
| Interquartile 25% (IQ1) | 3.1% | 1.7% |
| Interquartile 75% (IQ3) | 3.6% | 2.5% |
| Interquartile Range (IQR) | 0.52% | 0.79% |
| Standard Deviation (Sample) | 5.9% | 0.65% |
| Standard Deviation (Population) | 5.8% | 0.65% |
Similar Demographics by Hearing Disability
Demographics Similar to Italians by Hearing Disability
In terms of hearing disability, the demographic groups most similar to Italians are Yuman (3.4%, a difference of 0.010%), Hungarian (3.4%, a difference of 0.24%), Croatian (3.4%, a difference of 0.45%), Austrian (3.4%, a difference of 0.53%), and Lithuanian (3.4%, a difference of 0.75%).
| Demographics | Rating | Rank | Hearing Disability |
| Yugoslavians | 1.0 /100 | #242 | Tragic 3.3% |
| Immigrants | Western Europe | 1.0 /100 | #243 | Tragic 3.3% |
| Assyrians/Chaldeans/Syriacs | 0.9 /100 | #244 | Tragic 3.3% |
| Immigrants | Scotland | 0.8 /100 | #245 | Tragic 3.3% |
| Immigrants | England | 0.7 /100 | #246 | Tragic 3.3% |
| Lithuanians | 0.6 /100 | #247 | Tragic 3.4% |
| Austrians | 0.6 /100 | #248 | Tragic 3.4% |
| Italians | 0.4 /100 | #249 | Tragic 3.4% |
| Yuman | 0.4 /100 | #250 | Tragic 3.4% |
| Hungarians | 0.4 /100 | #251 | Tragic 3.4% |
| Croatians | 0.4 /100 | #252 | Tragic 3.4% |
| Carpatho Rusyns | 0.3 /100 | #253 | Tragic 3.4% |
| Slavs | 0.2 /100 | #254 | Tragic 3.4% |
| Poles | 0.2 /100 | #255 | Tragic 3.4% |
| Hmong | 0.2 /100 | #256 | Tragic 3.4% |
Demographics Similar to Thais by Hearing Disability
In terms of hearing disability, the demographic groups most similar to Thais are Dominican (2.5%, a difference of 0.030%), Immigrants from Bolivia (2.5%, a difference of 0.050%), Ghanaian (2.5%, a difference of 0.11%), Immigrants from Sierra Leone (2.6%, a difference of 0.16%), and Immigrants from Nigeria (2.6%, a difference of 0.65%).
| Demographics | Rating | Rank | Hearing Disability |
| Trinidadians and Tobagonians | 99.9 /100 | #12 | Exceptional 2.5% |
| Sierra Leoneans | 99.9 /100 | #13 | Exceptional 2.5% |
| Ecuadorians | 99.9 /100 | #14 | Exceptional 2.5% |
| Barbadians | 99.9 /100 | #15 | Exceptional 2.5% |
| Immigrants | West Indies | 99.9 /100 | #16 | Exceptional 2.5% |
| Immigrants | India | 99.9 /100 | #17 | Exceptional 2.5% |
| Dominicans | 99.8 /100 | #18 | Exceptional 2.5% |
| Thais | 99.8 /100 | #19 | Exceptional 2.5% |
| Immigrants | Bolivia | 99.8 /100 | #20 | Exceptional 2.5% |
| Ghanaians | 99.8 /100 | #21 | Exceptional 2.5% |
| Immigrants | Sierra Leone | 99.8 /100 | #22 | Exceptional 2.6% |
| Immigrants | Nigeria | 99.8 /100 | #23 | Exceptional 2.6% |
| Immigrants | Ghana | 99.8 /100 | #24 | Exceptional 2.6% |
| Immigrants | El Salvador | 99.7 /100 | #25 | Exceptional 2.6% |
| Immigrants | Senegal | 99.7 /100 | #26 | Exceptional 2.6% |