Immigrants from Norway vs Thai Hearing Disability
COMPARE
Immigrants from Norway
Thai
Hearing Disability
Hearing Disability Comparison
Immigrants from Norway
Thais
3.2%
HEARING DISABILITY
7.3/ 100
METRIC RATING
216th/ 347
METRIC RANK
2.5%
HEARING DISABILITY
99.8/ 100
METRIC RATING
19th/ 347
METRIC RANK
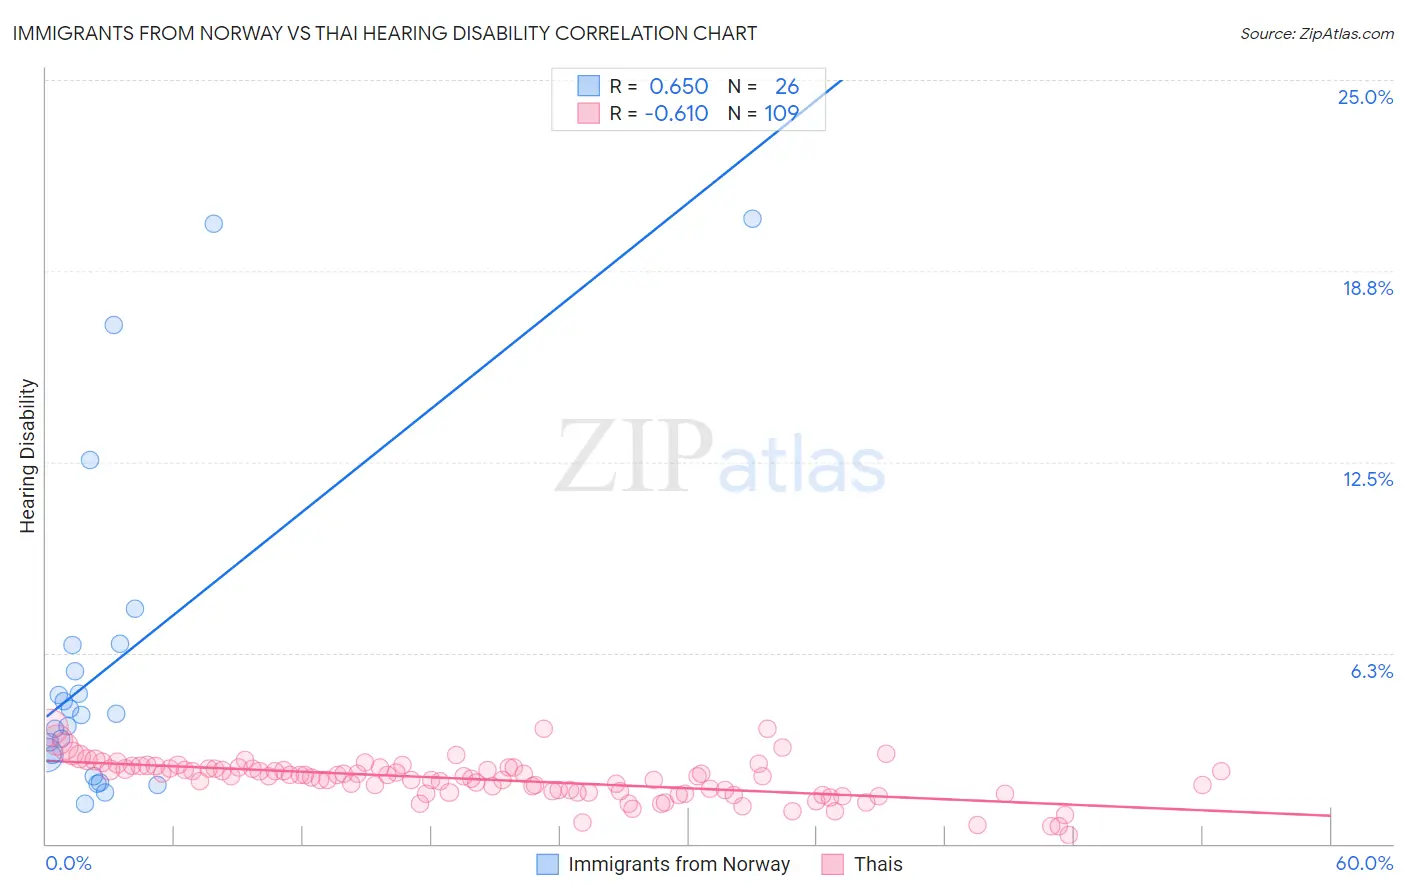
Immigrants from Norway vs Thai Hearing Disability Correlation Chart
The statistical analysis conducted on geographies consisting of 116,704,469 people shows a significant positive correlation between the proportion of Immigrants from Norway and percentage of population with hearing disability in the United States with a correlation coefficient (R) of 0.650 and weighted average of 3.2%. Similarly, the statistical analysis conducted on geographies consisting of 475,566,624 people shows a significant negative correlation between the proportion of Thais and percentage of population with hearing disability in the United States with a correlation coefficient (R) of -0.610 and weighted average of 2.5%, a difference of 24.6%.
Hearing Disability Correlation Summary
| Measurement | Immigrants from Norway | Thai |
| Minimum | 1.3% | 0.30% |
| Maximum | 20.5% | 3.8% |
| Range | 19.1% | 3.5% |
| Mean | 6.0% | 2.1% |
| Median | 4.2% | 2.2% |
| Interquartile 25% (IQ1) | 2.9% | 1.7% |
| Interquartile 75% (IQ3) | 6.5% | 2.5% |
| Interquartile Range (IQR) | 3.6% | 0.79% |
| Standard Deviation (Sample) | 5.4% | 0.65% |
| Standard Deviation (Population) | 5.3% | 0.65% |
Similar Demographics by Hearing Disability
Demographics Similar to Immigrants from Norway by Hearing Disability
In terms of hearing disability, the demographic groups most similar to Immigrants from Norway are Russian (3.2%, a difference of 0.080%), Immigrants from Northern Europe (3.2%, a difference of 0.12%), New Zealander (3.2%, a difference of 0.17%), Bangladeshi (3.2%, a difference of 0.24%), and Malaysian (3.2%, a difference of 0.24%).
| Demographics | Rating | Rank | Hearing Disability |
| Immigrants | Hungary | 12.5 /100 | #209 | Poor 3.1% |
| Cape Verdeans | 12.2 /100 | #210 | Poor 3.1% |
| Romanians | 12.1 /100 | #211 | Poor 3.1% |
| Pakistanis | 11.1 /100 | #212 | Poor 3.1% |
| Immigrants | Iraq | 10.5 /100 | #213 | Poor 3.1% |
| Australians | 8.1 /100 | #214 | Tragic 3.2% |
| Bangladeshis | 8.1 /100 | #215 | Tragic 3.2% |
| Immigrants | Norway | 7.3 /100 | #216 | Tragic 3.2% |
| Russians | 7.1 /100 | #217 | Tragic 3.2% |
| Immigrants | Northern Europe | 7.0 /100 | #218 | Tragic 3.2% |
| New Zealanders | 6.8 /100 | #219 | Tragic 3.2% |
| Malaysians | 6.6 /100 | #220 | Tragic 3.2% |
| Immigrants | Laos | 6.6 /100 | #221 | Tragic 3.2% |
| Immigrants | Oceania | 6.5 /100 | #222 | Tragic 3.2% |
| Mexicans | 5.6 /100 | #223 | Tragic 3.2% |
Demographics Similar to Thais by Hearing Disability
In terms of hearing disability, the demographic groups most similar to Thais are Dominican (2.5%, a difference of 0.030%), Immigrants from Bolivia (2.5%, a difference of 0.050%), Ghanaian (2.5%, a difference of 0.11%), Immigrants from Sierra Leone (2.6%, a difference of 0.16%), and Immigrants from Nigeria (2.6%, a difference of 0.65%).
| Demographics | Rating | Rank | Hearing Disability |
| Trinidadians and Tobagonians | 99.9 /100 | #12 | Exceptional 2.5% |
| Sierra Leoneans | 99.9 /100 | #13 | Exceptional 2.5% |
| Ecuadorians | 99.9 /100 | #14 | Exceptional 2.5% |
| Barbadians | 99.9 /100 | #15 | Exceptional 2.5% |
| Immigrants | West Indies | 99.9 /100 | #16 | Exceptional 2.5% |
| Immigrants | India | 99.9 /100 | #17 | Exceptional 2.5% |
| Dominicans | 99.8 /100 | #18 | Exceptional 2.5% |
| Thais | 99.8 /100 | #19 | Exceptional 2.5% |
| Immigrants | Bolivia | 99.8 /100 | #20 | Exceptional 2.5% |
| Ghanaians | 99.8 /100 | #21 | Exceptional 2.5% |
| Immigrants | Sierra Leone | 99.8 /100 | #22 | Exceptional 2.6% |
| Immigrants | Nigeria | 99.8 /100 | #23 | Exceptional 2.6% |
| Immigrants | Ghana | 99.8 /100 | #24 | Exceptional 2.6% |
| Immigrants | El Salvador | 99.7 /100 | #25 | Exceptional 2.6% |
| Immigrants | Senegal | 99.7 /100 | #26 | Exceptional 2.6% |