Dutch West Indian vs Spanish Ambulatory Disability
COMPARE
Dutch West Indian
Spanish
Ambulatory Disability
Ambulatory Disability Comparison
Dutch West Indians
Spanish
8.2%
AMBULATORY DISABILITY
0.0/ 100
METRIC RATING
337th/ 347
METRIC RANK
6.6%
AMBULATORY DISABILITY
0.2/ 100
METRIC RATING
268th/ 347
METRIC RANK
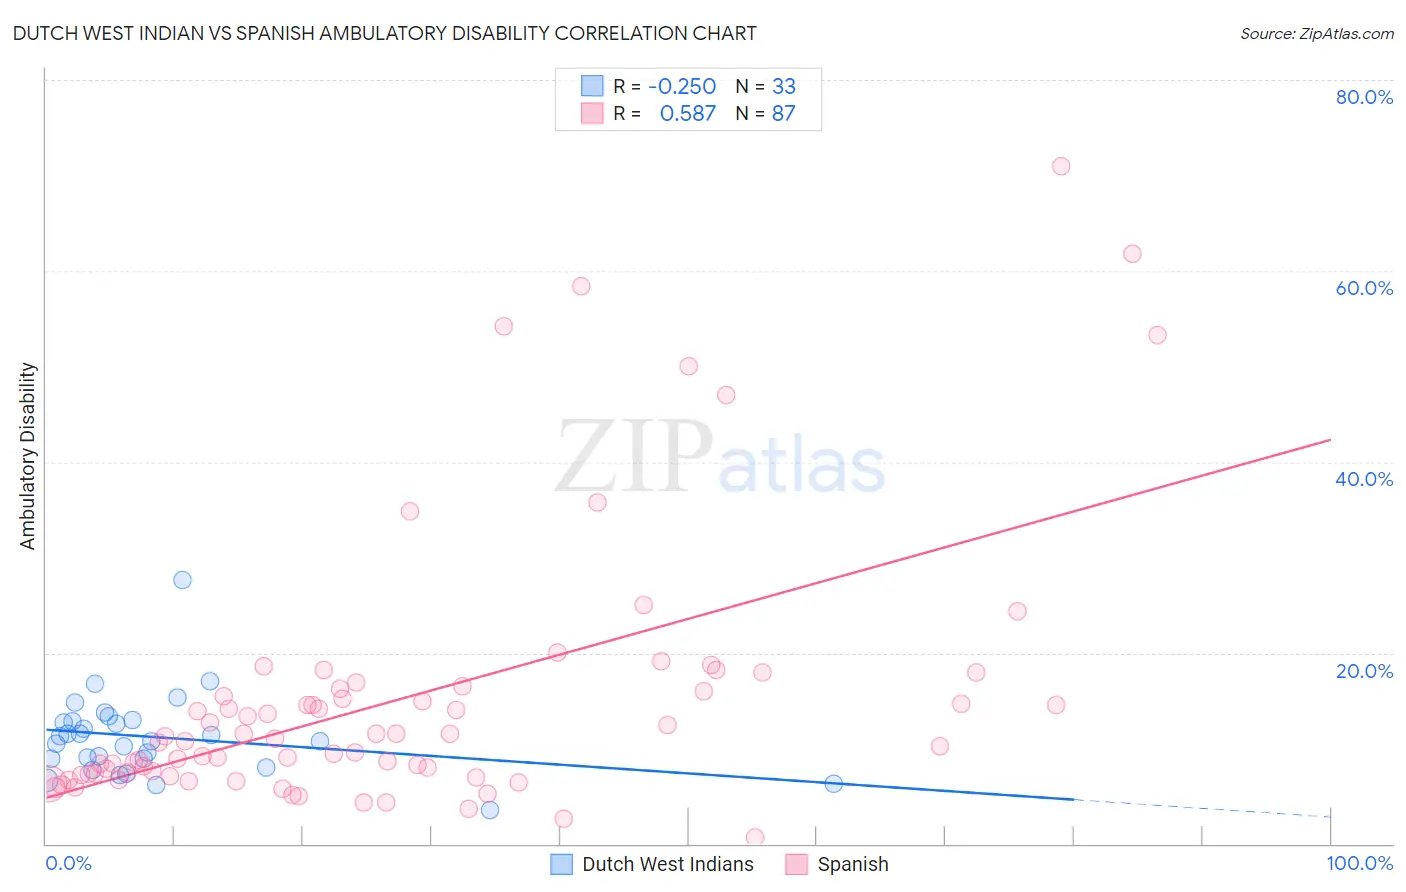
Dutch West Indian vs Spanish Ambulatory Disability Correlation Chart
The statistical analysis conducted on geographies consisting of 85,765,361 people shows a weak negative correlation between the proportion of Dutch West Indians and percentage of population with ambulatory disability in the United States with a correlation coefficient (R) of -0.250 and weighted average of 8.2%. Similarly, the statistical analysis conducted on geographies consisting of 421,992,199 people shows a substantial positive correlation between the proportion of Spanish and percentage of population with ambulatory disability in the United States with a correlation coefficient (R) of 0.587 and weighted average of 6.6%, a difference of 23.3%.
Ambulatory Disability Correlation Summary
| Measurement | Dutch West Indian | Spanish |
| Minimum | 3.6% | 0.68% |
| Maximum | 27.7% | 71.0% |
| Range | 24.1% | 70.3% |
| Mean | 11.2% | 15.1% |
| Median | 10.7% | 11.0% |
| Interquartile 25% (IQ1) | 8.5% | 7.3% |
| Interquartile 75% (IQ3) | 12.9% | 16.2% |
| Interquartile Range (IQR) | 4.4% | 8.9% |
| Standard Deviation (Sample) | 4.3% | 13.9% |
| Standard Deviation (Population) | 4.2% | 13.8% |
Similar Demographics by Ambulatory Disability
Demographics Similar to Dutch West Indians by Ambulatory Disability
In terms of ambulatory disability, the demographic groups most similar to Dutch West Indians are Colville (8.2%, a difference of 0.57%), Pima (8.2%, a difference of 0.92%), Seminole (8.0%, a difference of 1.6%), Chickasaw (8.0%, a difference of 1.7%), and Choctaw (8.3%, a difference of 1.8%).
| Demographics | Rating | Rank | Ambulatory Disability |
| Paiute | 0.0 /100 | #330 | Tragic 7.7% |
| Cajuns | 0.0 /100 | #331 | Tragic 7.8% |
| Menominee | 0.0 /100 | #332 | Tragic 7.8% |
| Cherokee | 0.0 /100 | #333 | Tragic 7.9% |
| Yuman | 0.0 /100 | #334 | Tragic 7.9% |
| Chickasaw | 0.0 /100 | #335 | Tragic 8.0% |
| Seminole | 0.0 /100 | #336 | Tragic 8.0% |
| Dutch West Indians | 0.0 /100 | #337 | Tragic 8.2% |
| Colville | 0.0 /100 | #338 | Tragic 8.2% |
| Pima | 0.0 /100 | #339 | Tragic 8.2% |
| Choctaw | 0.0 /100 | #340 | Tragic 8.3% |
| Creek | 0.0 /100 | #341 | Tragic 8.5% |
| Kiowa | 0.0 /100 | #342 | Tragic 8.6% |
| Tohono O'odham | 0.0 /100 | #343 | Tragic 8.7% |
| Tsimshian | 0.0 /100 | #344 | Tragic 8.8% |
Demographics Similar to Spanish by Ambulatory Disability
In terms of ambulatory disability, the demographic groups most similar to Spanish are Trinidadian and Tobagonian (6.6%, a difference of 0.020%), Guyanese (6.6%, a difference of 0.14%), Bahamian (6.6%, a difference of 0.26%), French (6.6%, a difference of 0.31%), and Nepalese (6.6%, a difference of 0.33%).
| Demographics | Rating | Rank | Ambulatory Disability |
| Irish | 0.4 /100 | #261 | Tragic 6.6% |
| English | 0.4 /100 | #262 | Tragic 6.6% |
| Hmong | 0.3 /100 | #263 | Tragic 6.6% |
| Nepalese | 0.2 /100 | #264 | Tragic 6.6% |
| Bahamians | 0.2 /100 | #265 | Tragic 6.6% |
| Guyanese | 0.2 /100 | #266 | Tragic 6.6% |
| Trinidadians and Tobagonians | 0.2 /100 | #267 | Tragic 6.6% |
| Spanish | 0.2 /100 | #268 | Tragic 6.6% |
| French | 0.1 /100 | #269 | Tragic 6.6% |
| Slovaks | 0.1 /100 | #270 | Tragic 6.7% |
| Immigrants | Trinidad and Tobago | 0.1 /100 | #271 | Tragic 6.7% |
| French Canadians | 0.1 /100 | #272 | Tragic 6.7% |
| Whites/Caucasians | 0.1 /100 | #273 | Tragic 6.7% |
| Sioux | 0.1 /100 | #274 | Tragic 6.7% |
| Immigrants | Guyana | 0.1 /100 | #275 | Tragic 6.7% |