Immigrants from Portugal vs Immigrants from Argentina Hearing Disability
COMPARE
Immigrants from Portugal
Immigrants from Argentina
Hearing Disability
Hearing Disability Comparison
Immigrants from Portugal
Immigrants from Argentina
3.2%
HEARING DISABILITY
4.3/ 100
METRIC RATING
228th/ 347
METRIC RANK
2.8%
HEARING DISABILITY
97.0/ 100
METRIC RATING
84th/ 347
METRIC RANK
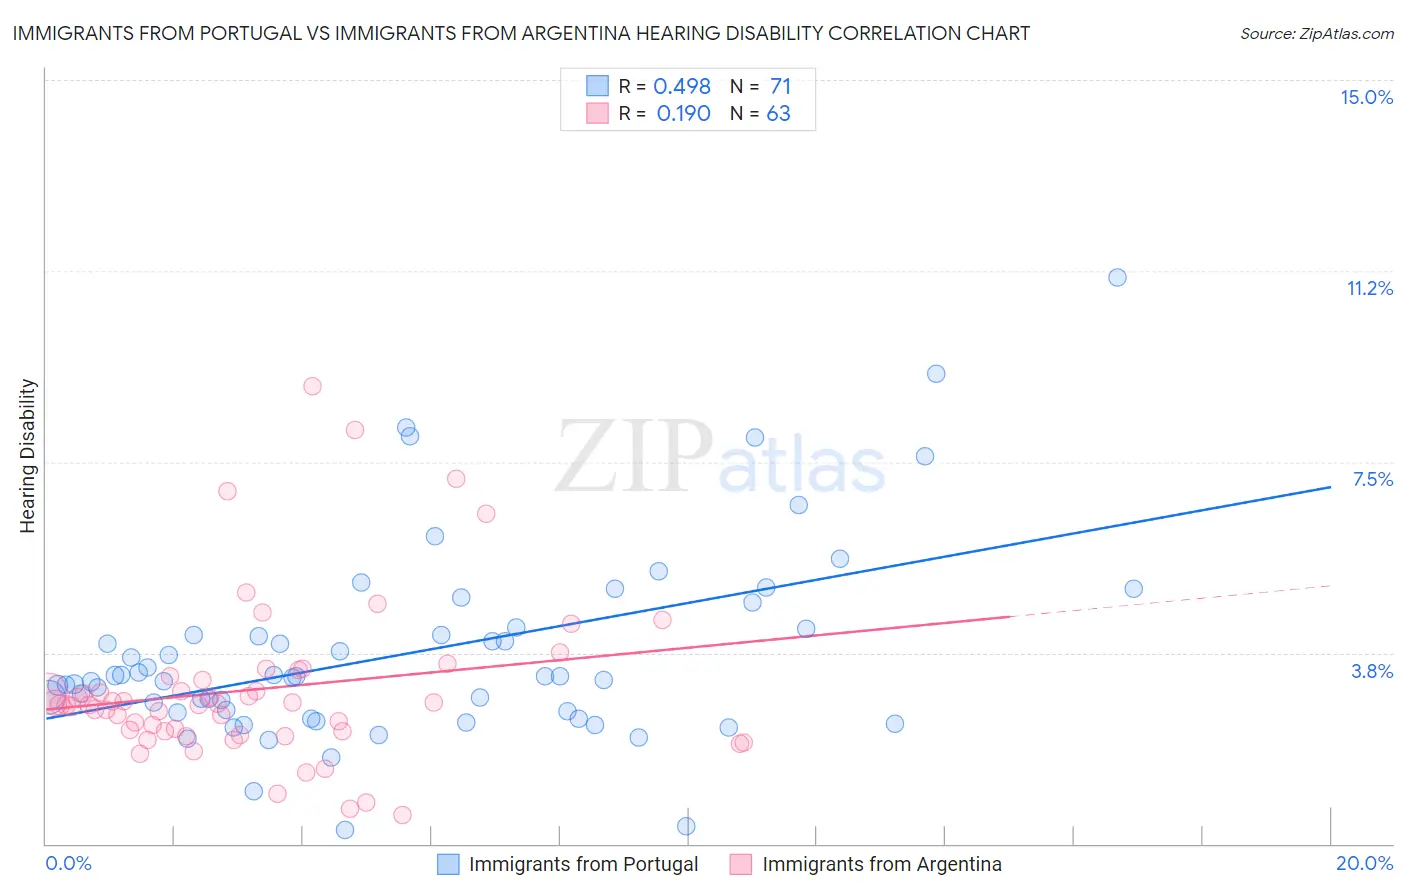
Immigrants from Portugal vs Immigrants from Argentina Hearing Disability Correlation Chart
The statistical analysis conducted on geographies consisting of 174,768,283 people shows a moderate positive correlation between the proportion of Immigrants from Portugal and percentage of population with hearing disability in the United States with a correlation coefficient (R) of 0.498 and weighted average of 3.2%. Similarly, the statistical analysis conducted on geographies consisting of 264,393,867 people shows a poor positive correlation between the proportion of Immigrants from Argentina and percentage of population with hearing disability in the United States with a correlation coefficient (R) of 0.190 and weighted average of 2.8%, a difference of 16.8%.
Hearing Disability Correlation Summary
| Measurement | Immigrants from Portugal | Immigrants from Argentina |
| Minimum | 0.28% | 0.57% |
| Maximum | 11.1% | 9.0% |
| Range | 10.8% | 8.4% |
| Mean | 3.7% | 3.0% |
| Median | 3.3% | 2.7% |
| Interquartile 25% (IQ1) | 2.6% | 2.2% |
| Interquartile 75% (IQ3) | 4.2% | 3.3% |
| Interquartile Range (IQR) | 1.6% | 1.1% |
| Standard Deviation (Sample) | 1.9% | 1.6% |
| Standard Deviation (Population) | 1.9% | 1.6% |
Similar Demographics by Hearing Disability
Demographics Similar to Immigrants from Portugal by Hearing Disability
In terms of hearing disability, the demographic groups most similar to Immigrants from Portugal are Maltese (3.2%, a difference of 0.11%), Bhutanese (3.2%, a difference of 0.20%), Lebanese (3.2%, a difference of 0.38%), Latvian (3.2%, a difference of 0.42%), and Icelander (3.2%, a difference of 0.47%).
| Demographics | Rating | Rank | Hearing Disability |
| Immigrants | Laos | 6.6 /100 | #221 | Tragic 3.2% |
| Immigrants | Oceania | 6.5 /100 | #222 | Tragic 3.2% |
| Mexicans | 5.6 /100 | #223 | Tragic 3.2% |
| Icelanders | 5.2 /100 | #224 | Tragic 3.2% |
| Latvians | 5.1 /100 | #225 | Tragic 3.2% |
| Lebanese | 5.0 /100 | #226 | Tragic 3.2% |
| Bhutanese | 4.6 /100 | #227 | Tragic 3.2% |
| Immigrants | Portugal | 4.3 /100 | #228 | Tragic 3.2% |
| Maltese | 4.1 /100 | #229 | Tragic 3.2% |
| Greeks | 3.2 /100 | #230 | Tragic 3.2% |
| Luxembourgers | 2.9 /100 | #231 | Tragic 3.2% |
| Ukrainians | 2.9 /100 | #232 | Tragic 3.2% |
| Estonians | 2.4 /100 | #233 | Tragic 3.3% |
| Central American Indians | 2.3 /100 | #234 | Tragic 3.3% |
| Guamanians/Chamorros | 2.2 /100 | #235 | Tragic 3.3% |
Demographics Similar to Immigrants from Argentina by Hearing Disability
In terms of hearing disability, the demographic groups most similar to Immigrants from Argentina are Immigrants from Northern Africa (2.8%, a difference of 0.070%), Immigrants from Iran (2.8%, a difference of 0.10%), Immigrants from Cuba (2.7%, a difference of 0.19%), Immigrants from Armenia (2.7%, a difference of 0.21%), and Somali (2.8%, a difference of 0.21%).
| Demographics | Rating | Rank | Hearing Disability |
| Immigrants | Malaysia | 97.5 /100 | #77 | Exceptional 2.7% |
| Mongolians | 97.4 /100 | #78 | Exceptional 2.7% |
| Colombians | 97.4 /100 | #79 | Exceptional 2.7% |
| Immigrants | Asia | 97.2 /100 | #80 | Exceptional 2.7% |
| Immigrants | Uruguay | 97.2 /100 | #81 | Exceptional 2.7% |
| Immigrants | Armenia | 97.2 /100 | #82 | Exceptional 2.7% |
| Immigrants | Cuba | 97.2 /100 | #83 | Exceptional 2.7% |
| Immigrants | Argentina | 97.0 /100 | #84 | Exceptional 2.8% |
| Immigrants | Northern Africa | 96.9 /100 | #85 | Exceptional 2.8% |
| Immigrants | Iran | 96.8 /100 | #86 | Exceptional 2.8% |
| Somalis | 96.7 /100 | #87 | Exceptional 2.8% |
| Immigrants | Turkey | 96.7 /100 | #88 | Exceptional 2.8% |
| Belizeans | 96.6 /100 | #89 | Exceptional 2.8% |
| Immigrants | Morocco | 96.6 /100 | #90 | Exceptional 2.8% |
| Immigrants | Middle Africa | 96.5 /100 | #91 | Exceptional 2.8% |