Immigrants from Portugal vs Colville Hearing Disability
COMPARE
Immigrants from Portugal
Colville
Hearing Disability
Hearing Disability Comparison
Immigrants from Portugal
Colville
3.2%
HEARING DISABILITY
4.3/ 100
METRIC RATING
228th/ 347
METRIC RANK
5.3%
HEARING DISABILITY
0.0/ 100
METRIC RATING
346th/ 347
METRIC RANK
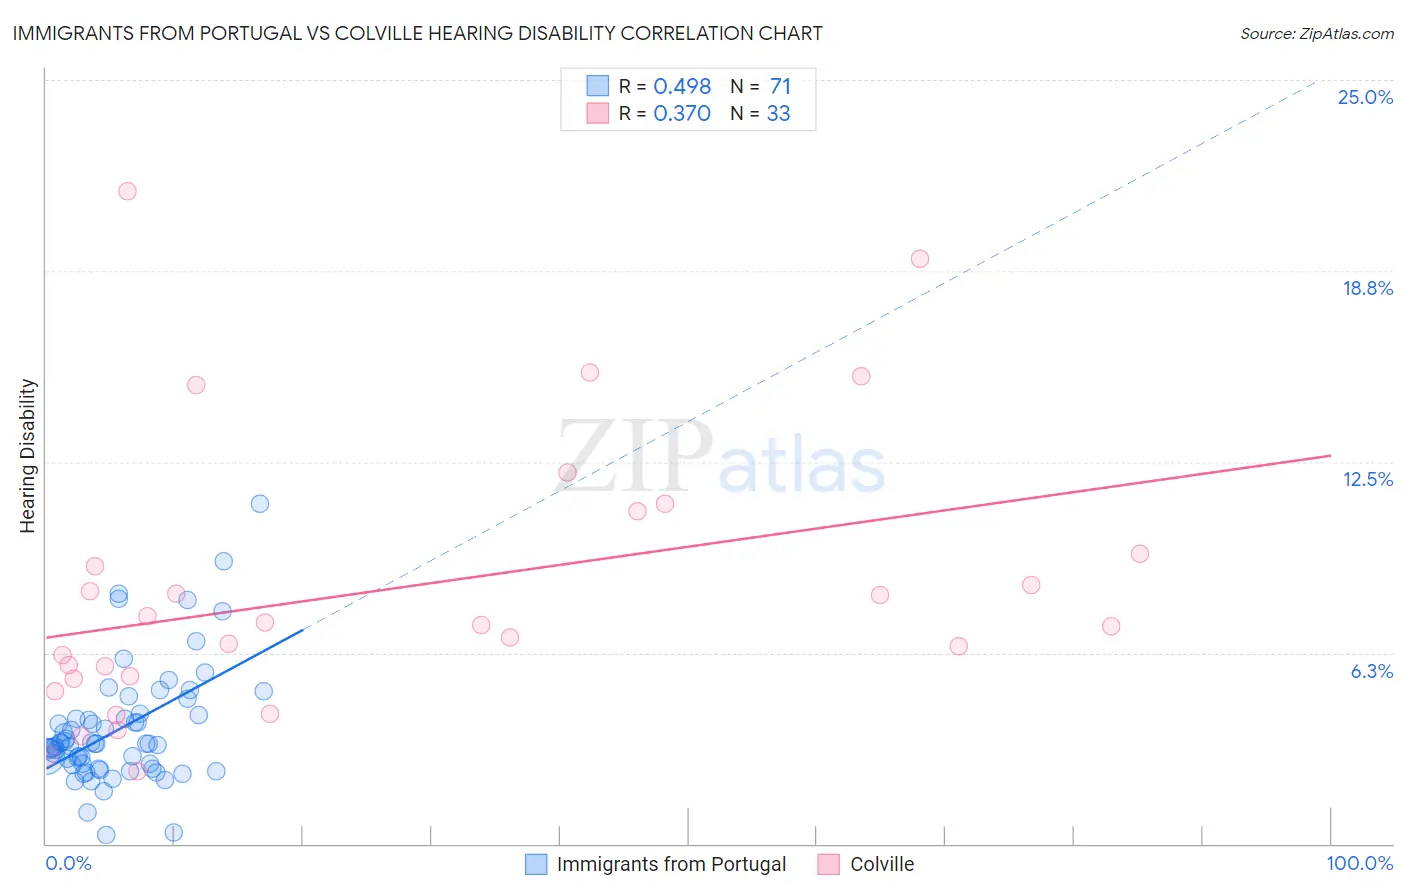
Immigrants from Portugal vs Colville Hearing Disability Correlation Chart
The statistical analysis conducted on geographies consisting of 174,768,283 people shows a moderate positive correlation between the proportion of Immigrants from Portugal and percentage of population with hearing disability in the United States with a correlation coefficient (R) of 0.498 and weighted average of 3.2%. Similarly, the statistical analysis conducted on geographies consisting of 34,687,289 people shows a mild positive correlation between the proportion of Colville and percentage of population with hearing disability in the United States with a correlation coefficient (R) of 0.370 and weighted average of 5.3%, a difference of 66.4%.
Hearing Disability Correlation Summary
| Measurement | Immigrants from Portugal | Colville |
| Minimum | 0.28% | 2.4% |
| Maximum | 11.1% | 21.4% |
| Range | 10.8% | 19.0% |
| Mean | 3.7% | 8.3% |
| Median | 3.3% | 7.2% |
| Interquartile 25% (IQ1) | 2.6% | 5.5% |
| Interquartile 75% (IQ3) | 4.2% | 10.2% |
| Interquartile Range (IQR) | 1.6% | 4.7% |
| Standard Deviation (Sample) | 1.9% | 4.6% |
| Standard Deviation (Population) | 1.9% | 4.5% |
Similar Demographics by Hearing Disability
Demographics Similar to Immigrants from Portugal by Hearing Disability
In terms of hearing disability, the demographic groups most similar to Immigrants from Portugal are Maltese (3.2%, a difference of 0.11%), Bhutanese (3.2%, a difference of 0.20%), Lebanese (3.2%, a difference of 0.38%), Latvian (3.2%, a difference of 0.42%), and Icelander (3.2%, a difference of 0.47%).
| Demographics | Rating | Rank | Hearing Disability |
| Immigrants | Laos | 6.6 /100 | #221 | Tragic 3.2% |
| Immigrants | Oceania | 6.5 /100 | #222 | Tragic 3.2% |
| Mexicans | 5.6 /100 | #223 | Tragic 3.2% |
| Icelanders | 5.2 /100 | #224 | Tragic 3.2% |
| Latvians | 5.1 /100 | #225 | Tragic 3.2% |
| Lebanese | 5.0 /100 | #226 | Tragic 3.2% |
| Bhutanese | 4.6 /100 | #227 | Tragic 3.2% |
| Immigrants | Portugal | 4.3 /100 | #228 | Tragic 3.2% |
| Maltese | 4.1 /100 | #229 | Tragic 3.2% |
| Greeks | 3.2 /100 | #230 | Tragic 3.2% |
| Luxembourgers | 2.9 /100 | #231 | Tragic 3.2% |
| Ukrainians | 2.9 /100 | #232 | Tragic 3.2% |
| Estonians | 2.4 /100 | #233 | Tragic 3.3% |
| Central American Indians | 2.3 /100 | #234 | Tragic 3.3% |
| Guamanians/Chamorros | 2.2 /100 | #235 | Tragic 3.3% |
Demographics Similar to Colville by Hearing Disability
In terms of hearing disability, the demographic groups most similar to Colville are Alaskan Athabascan (5.3%, a difference of 0.43%), Yup'ik (5.8%, a difference of 9.3%), Tlingit-Haida (4.8%, a difference of 10.4%), Inupiat (4.7%, a difference of 13.4%), and Tsimshian (4.7%, a difference of 13.7%).
| Demographics | Rating | Rank | Hearing Disability |
| Dutch West Indians | 0.0 /100 | #333 | Tragic 4.3% |
| Aleuts | 0.0 /100 | #334 | Tragic 4.3% |
| Kiowa | 0.0 /100 | #335 | Tragic 4.3% |
| Creek | 0.0 /100 | #336 | Tragic 4.4% |
| Chickasaw | 0.0 /100 | #337 | Tragic 4.5% |
| Alaska Natives | 0.0 /100 | #338 | Tragic 4.5% |
| Choctaw | 0.0 /100 | #339 | Tragic 4.5% |
| Pueblo | 0.0 /100 | #340 | Tragic 4.6% |
| Navajo | 0.0 /100 | #341 | Tragic 4.6% |
| Tsimshian | 0.0 /100 | #342 | Tragic 4.7% |
| Inupiat | 0.0 /100 | #343 | Tragic 4.7% |
| Tlingit-Haida | 0.0 /100 | #344 | Tragic 4.8% |
| Alaskan Athabascans | 0.0 /100 | #345 | Tragic 5.3% |
| Colville | 0.0 /100 | #346 | Tragic 5.3% |
| Yup'ik | 0.0 /100 | #347 | Tragic 5.8% |