Native Hawaiian vs Immigrants from Argentina Hearing Disability
COMPARE
Native Hawaiian
Immigrants from Argentina
Hearing Disability
Hearing Disability Comparison
Native Hawaiians
Immigrants from Argentina
3.7%
HEARING DISABILITY
0.0/ 100
METRIC RATING
292nd/ 347
METRIC RANK
2.8%
HEARING DISABILITY
97.0/ 100
METRIC RATING
84th/ 347
METRIC RANK
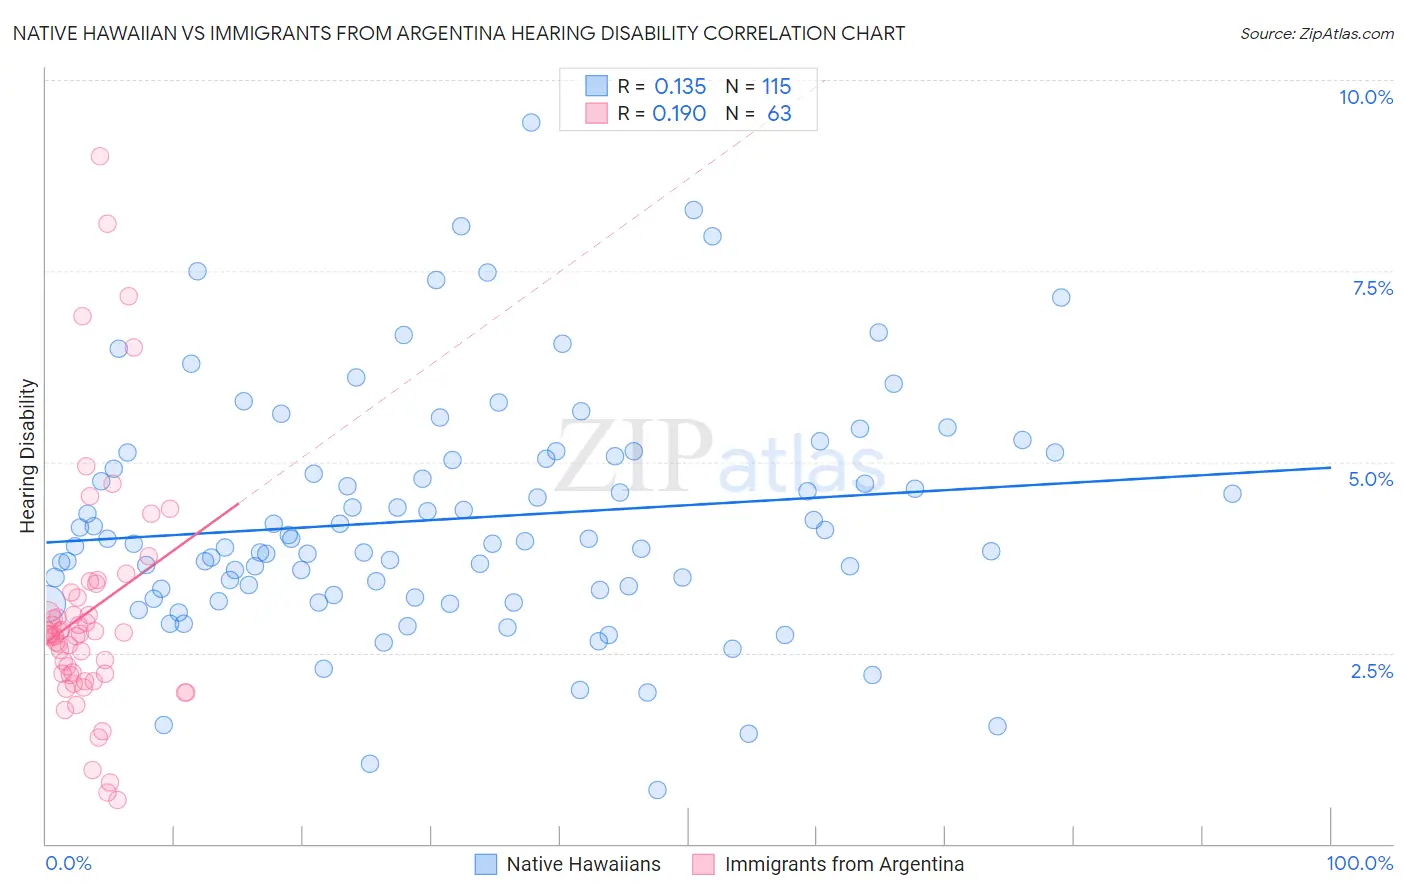
Native Hawaiian vs Immigrants from Argentina Hearing Disability Correlation Chart
The statistical analysis conducted on geographies consisting of 331,966,611 people shows a poor positive correlation between the proportion of Native Hawaiians and percentage of population with hearing disability in the United States with a correlation coefficient (R) of 0.135 and weighted average of 3.7%. Similarly, the statistical analysis conducted on geographies consisting of 264,393,867 people shows a poor positive correlation between the proportion of Immigrants from Argentina and percentage of population with hearing disability in the United States with a correlation coefficient (R) of 0.190 and weighted average of 2.8%, a difference of 34.0%.
Hearing Disability Correlation Summary
| Measurement | Native Hawaiian | Immigrants from Argentina |
| Minimum | 0.70% | 0.57% |
| Maximum | 9.4% | 9.0% |
| Range | 8.7% | 8.4% |
| Mean | 4.3% | 3.0% |
| Median | 4.0% | 2.7% |
| Interquartile 25% (IQ1) | 3.3% | 2.2% |
| Interquartile 75% (IQ3) | 5.1% | 3.3% |
| Interquartile Range (IQR) | 1.7% | 1.1% |
| Standard Deviation (Sample) | 1.6% | 1.6% |
| Standard Deviation (Population) | 1.5% | 1.6% |
Similar Demographics by Hearing Disability
Demographics Similar to Native Hawaiians by Hearing Disability
In terms of hearing disability, the demographic groups most similar to Native Hawaiians are Finnish (3.7%, a difference of 0.060%), Norwegian (3.7%, a difference of 0.060%), White/Caucasian (3.7%, a difference of 0.080%), Chinese (3.7%, a difference of 0.21%), and Iroquois (3.7%, a difference of 0.30%).
| Demographics | Rating | Rank | Hearing Disability |
| Sioux | 0.0 /100 | #285 | Tragic 3.6% |
| Delaware | 0.0 /100 | #286 | Tragic 3.6% |
| Spanish | 0.0 /100 | #287 | Tragic 3.7% |
| Irish | 0.0 /100 | #288 | Tragic 3.7% |
| Chinese | 0.0 /100 | #289 | Tragic 3.7% |
| Whites/Caucasians | 0.0 /100 | #290 | Tragic 3.7% |
| Finns | 0.0 /100 | #291 | Tragic 3.7% |
| Native Hawaiians | 0.0 /100 | #292 | Tragic 3.7% |
| Norwegians | 0.0 /100 | #293 | Tragic 3.7% |
| Iroquois | 0.0 /100 | #294 | Tragic 3.7% |
| Welsh | 0.0 /100 | #295 | Tragic 3.7% |
| Pima | 0.0 /100 | #296 | Tragic 3.7% |
| Immigrants | Azores | 0.0 /100 | #297 | Tragic 3.7% |
| Celtics | 0.0 /100 | #298 | Tragic 3.7% |
| Germans | 0.0 /100 | #299 | Tragic 3.7% |
Demographics Similar to Immigrants from Argentina by Hearing Disability
In terms of hearing disability, the demographic groups most similar to Immigrants from Argentina are Immigrants from Northern Africa (2.8%, a difference of 0.070%), Immigrants from Iran (2.8%, a difference of 0.10%), Immigrants from Cuba (2.7%, a difference of 0.19%), Immigrants from Armenia (2.7%, a difference of 0.21%), and Somali (2.8%, a difference of 0.21%).
| Demographics | Rating | Rank | Hearing Disability |
| Immigrants | Malaysia | 97.5 /100 | #77 | Exceptional 2.7% |
| Mongolians | 97.4 /100 | #78 | Exceptional 2.7% |
| Colombians | 97.4 /100 | #79 | Exceptional 2.7% |
| Immigrants | Asia | 97.2 /100 | #80 | Exceptional 2.7% |
| Immigrants | Uruguay | 97.2 /100 | #81 | Exceptional 2.7% |
| Immigrants | Armenia | 97.2 /100 | #82 | Exceptional 2.7% |
| Immigrants | Cuba | 97.2 /100 | #83 | Exceptional 2.7% |
| Immigrants | Argentina | 97.0 /100 | #84 | Exceptional 2.8% |
| Immigrants | Northern Africa | 96.9 /100 | #85 | Exceptional 2.8% |
| Immigrants | Iran | 96.8 /100 | #86 | Exceptional 2.8% |
| Somalis | 96.7 /100 | #87 | Exceptional 2.8% |
| Immigrants | Turkey | 96.7 /100 | #88 | Exceptional 2.8% |
| Belizeans | 96.6 /100 | #89 | Exceptional 2.8% |
| Immigrants | Morocco | 96.6 /100 | #90 | Exceptional 2.8% |
| Immigrants | Middle Africa | 96.5 /100 | #91 | Exceptional 2.8% |