Immigrants from Portugal vs Marshallese Hearing Disability
COMPARE
Immigrants from Portugal
Marshallese
Hearing Disability
Hearing Disability Comparison
Immigrants from Portugal
Marshallese
3.2%
HEARING DISABILITY
4.3/ 100
METRIC RATING
228th/ 347
METRIC RANK
3.8%
HEARING DISABILITY
0.0/ 100
METRIC RATING
306th/ 347
METRIC RANK
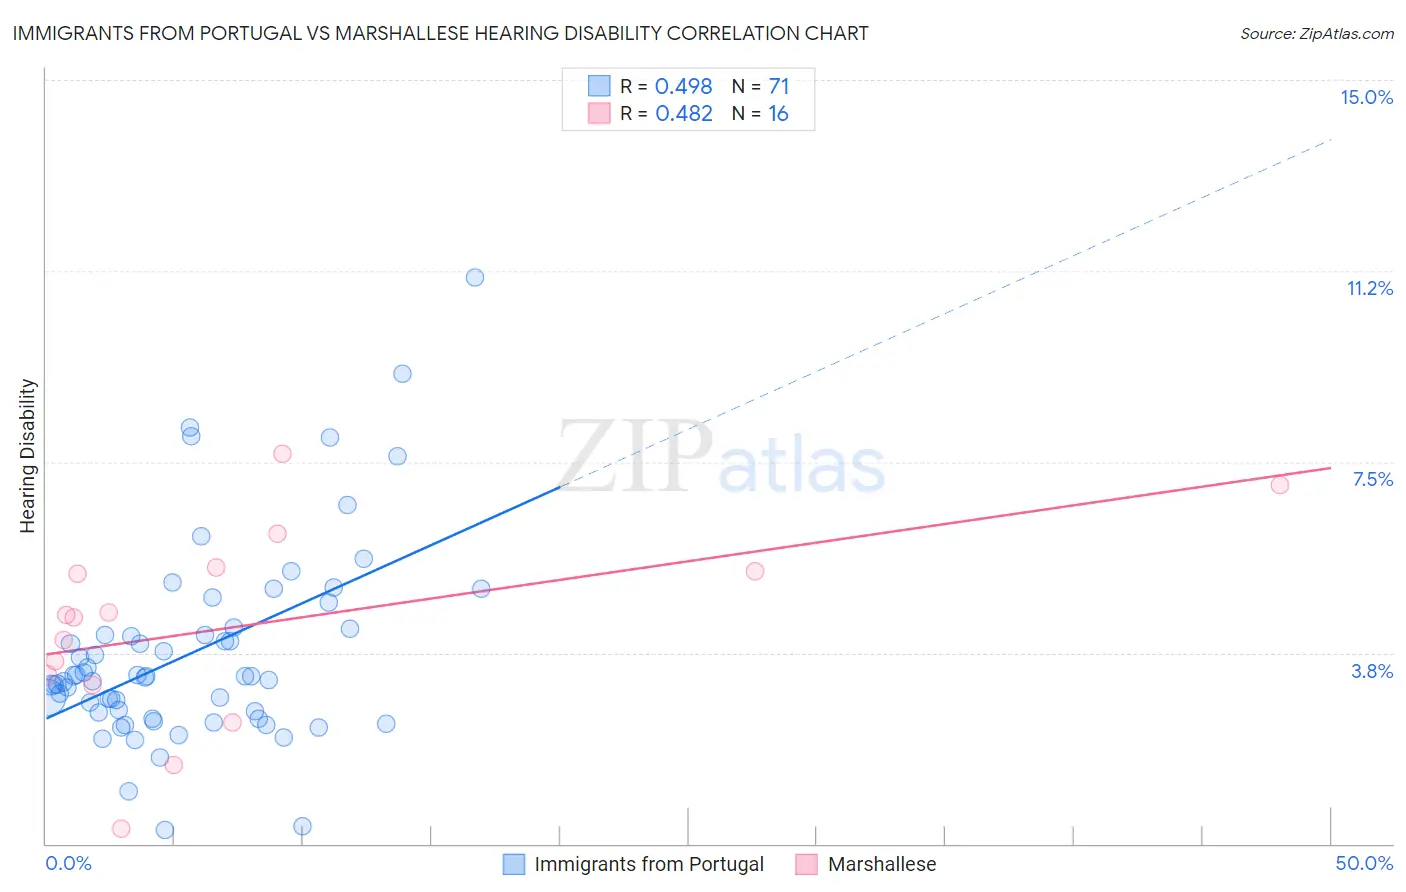
Immigrants from Portugal vs Marshallese Hearing Disability Correlation Chart
The statistical analysis conducted on geographies consisting of 174,768,283 people shows a moderate positive correlation between the proportion of Immigrants from Portugal and percentage of population with hearing disability in the United States with a correlation coefficient (R) of 0.498 and weighted average of 3.2%. Similarly, the statistical analysis conducted on geographies consisting of 14,761,315 people shows a moderate positive correlation between the proportion of Marshallese and percentage of population with hearing disability in the United States with a correlation coefficient (R) of 0.482 and weighted average of 3.8%, a difference of 18.5%.
Hearing Disability Correlation Summary
| Measurement | Immigrants from Portugal | Marshallese |
| Minimum | 0.28% | 0.29% |
| Maximum | 11.1% | 7.7% |
| Range | 10.8% | 7.4% |
| Mean | 3.7% | 4.3% |
| Median | 3.3% | 4.5% |
| Interquartile 25% (IQ1) | 2.6% | 3.2% |
| Interquartile 75% (IQ3) | 4.2% | 5.4% |
| Interquartile Range (IQR) | 1.6% | 2.2% |
| Standard Deviation (Sample) | 1.9% | 1.9% |
| Standard Deviation (Population) | 1.9% | 1.9% |
Similar Demographics by Hearing Disability
Demographics Similar to Immigrants from Portugal by Hearing Disability
In terms of hearing disability, the demographic groups most similar to Immigrants from Portugal are Maltese (3.2%, a difference of 0.11%), Bhutanese (3.2%, a difference of 0.20%), Lebanese (3.2%, a difference of 0.38%), Latvian (3.2%, a difference of 0.42%), and Icelander (3.2%, a difference of 0.47%).
| Demographics | Rating | Rank | Hearing Disability |
| Immigrants | Laos | 6.6 /100 | #221 | Tragic 3.2% |
| Immigrants | Oceania | 6.5 /100 | #222 | Tragic 3.2% |
| Mexicans | 5.6 /100 | #223 | Tragic 3.2% |
| Icelanders | 5.2 /100 | #224 | Tragic 3.2% |
| Latvians | 5.1 /100 | #225 | Tragic 3.2% |
| Lebanese | 5.0 /100 | #226 | Tragic 3.2% |
| Bhutanese | 4.6 /100 | #227 | Tragic 3.2% |
| Immigrants | Portugal | 4.3 /100 | #228 | Tragic 3.2% |
| Maltese | 4.1 /100 | #229 | Tragic 3.2% |
| Greeks | 3.2 /100 | #230 | Tragic 3.2% |
| Luxembourgers | 2.9 /100 | #231 | Tragic 3.2% |
| Ukrainians | 2.9 /100 | #232 | Tragic 3.2% |
| Estonians | 2.4 /100 | #233 | Tragic 3.3% |
| Central American Indians | 2.3 /100 | #234 | Tragic 3.3% |
| Guamanians/Chamorros | 2.2 /100 | #235 | Tragic 3.3% |
Demographics Similar to Marshallese by Hearing Disability
In terms of hearing disability, the demographic groups most similar to Marshallese are French Canadian (3.8%, a difference of 0.12%), Ottawa (3.8%, a difference of 0.56%), Scotch-Irish (3.8%, a difference of 0.64%), English (3.8%, a difference of 0.86%), and Cree (3.8%, a difference of 0.95%).
| Demographics | Rating | Rank | Hearing Disability |
| Germans | 0.0 /100 | #299 | Tragic 3.7% |
| Scottish | 0.0 /100 | #300 | Tragic 3.7% |
| Pennsylvania Germans | 0.0 /100 | #301 | Tragic 3.7% |
| Dutch | 0.0 /100 | #302 | Tragic 3.7% |
| Menominee | 0.0 /100 | #303 | Tragic 3.7% |
| French | 0.0 /100 | #304 | Tragic 3.8% |
| English | 0.0 /100 | #305 | Tragic 3.8% |
| Marshallese | 0.0 /100 | #306 | Tragic 3.8% |
| French Canadians | 0.0 /100 | #307 | Tragic 3.8% |
| Ottawa | 0.0 /100 | #308 | Tragic 3.8% |
| Scotch-Irish | 0.0 /100 | #309 | Tragic 3.8% |
| Cree | 0.0 /100 | #310 | Tragic 3.8% |
| Americans | 0.0 /100 | #311 | Tragic 3.9% |
| Cajuns | 0.0 /100 | #312 | Tragic 3.9% |
| Hopi | 0.0 /100 | #313 | Tragic 3.9% |