Immigrants from Portugal vs Ute Hearing Disability
COMPARE
Immigrants from Portugal
Ute
Hearing Disability
Hearing Disability Comparison
Immigrants from Portugal
Ute
3.2%
HEARING DISABILITY
4.3/ 100
METRIC RATING
228th/ 347
METRIC RANK
3.5%
HEARING DISABILITY
0.1/ 100
METRIC RATING
269th/ 347
METRIC RANK
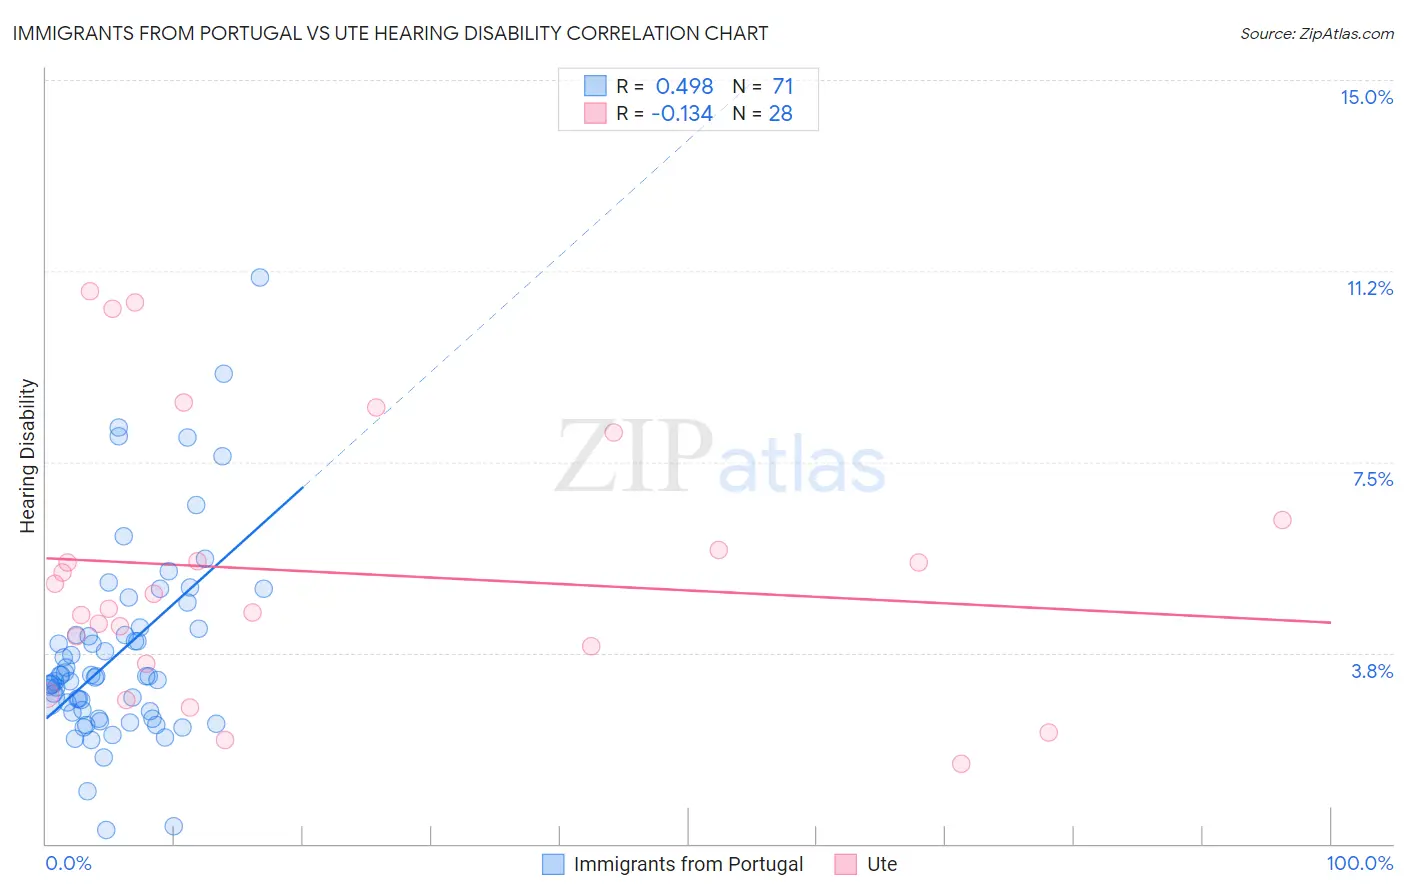
Immigrants from Portugal vs Ute Hearing Disability Correlation Chart
The statistical analysis conducted on geographies consisting of 174,768,283 people shows a moderate positive correlation between the proportion of Immigrants from Portugal and percentage of population with hearing disability in the United States with a correlation coefficient (R) of 0.498 and weighted average of 3.2%. Similarly, the statistical analysis conducted on geographies consisting of 55,656,713 people shows a poor negative correlation between the proportion of Ute and percentage of population with hearing disability in the United States with a correlation coefficient (R) of -0.134 and weighted average of 3.5%, a difference of 8.9%.
Hearing Disability Correlation Summary
| Measurement | Immigrants from Portugal | Ute |
| Minimum | 0.28% | 1.6% |
| Maximum | 11.1% | 10.9% |
| Range | 10.8% | 9.3% |
| Mean | 3.7% | 5.3% |
| Median | 3.3% | 4.8% |
| Interquartile 25% (IQ1) | 2.6% | 3.7% |
| Interquartile 75% (IQ3) | 4.2% | 6.1% |
| Interquartile Range (IQR) | 1.6% | 2.3% |
| Standard Deviation (Sample) | 1.9% | 2.6% |
| Standard Deviation (Population) | 1.9% | 2.5% |
Similar Demographics by Hearing Disability
Demographics Similar to Immigrants from Portugal by Hearing Disability
In terms of hearing disability, the demographic groups most similar to Immigrants from Portugal are Maltese (3.2%, a difference of 0.11%), Bhutanese (3.2%, a difference of 0.20%), Lebanese (3.2%, a difference of 0.38%), Latvian (3.2%, a difference of 0.42%), and Icelander (3.2%, a difference of 0.47%).
| Demographics | Rating | Rank | Hearing Disability |
| Immigrants | Laos | 6.6 /100 | #221 | Tragic 3.2% |
| Immigrants | Oceania | 6.5 /100 | #222 | Tragic 3.2% |
| Mexicans | 5.6 /100 | #223 | Tragic 3.2% |
| Icelanders | 5.2 /100 | #224 | Tragic 3.2% |
| Latvians | 5.1 /100 | #225 | Tragic 3.2% |
| Lebanese | 5.0 /100 | #226 | Tragic 3.2% |
| Bhutanese | 4.6 /100 | #227 | Tragic 3.2% |
| Immigrants | Portugal | 4.3 /100 | #228 | Tragic 3.2% |
| Maltese | 4.1 /100 | #229 | Tragic 3.2% |
| Greeks | 3.2 /100 | #230 | Tragic 3.2% |
| Luxembourgers | 2.9 /100 | #231 | Tragic 3.2% |
| Ukrainians | 2.9 /100 | #232 | Tragic 3.2% |
| Estonians | 2.4 /100 | #233 | Tragic 3.3% |
| Central American Indians | 2.3 /100 | #234 | Tragic 3.3% |
| Guamanians/Chamorros | 2.2 /100 | #235 | Tragic 3.3% |
Demographics Similar to Ute by Hearing Disability
In terms of hearing disability, the demographic groups most similar to Ute are Spaniard (3.5%, a difference of 0.30%), Canadian (3.5%, a difference of 0.32%), European (3.5%, a difference of 0.35%), Belgian (3.5%, a difference of 0.54%), and Czech (3.5%, a difference of 0.61%).
| Demographics | Rating | Rank | Hearing Disability |
| Immigrants | North America | 0.1 /100 | #262 | Tragic 3.5% |
| Immigrants | Canada | 0.1 /100 | #263 | Tragic 3.5% |
| Immigrants | Germany | 0.1 /100 | #264 | Tragic 3.5% |
| British | 0.1 /100 | #265 | Tragic 3.5% |
| Belgians | 0.1 /100 | #266 | Tragic 3.5% |
| Canadians | 0.1 /100 | #267 | Tragic 3.5% |
| Spaniards | 0.1 /100 | #268 | Tragic 3.5% |
| Ute | 0.1 /100 | #269 | Tragic 3.5% |
| Europeans | 0.1 /100 | #270 | Tragic 3.5% |
| Czechs | 0.1 /100 | #271 | Tragic 3.5% |
| Fijians | 0.0 /100 | #272 | Tragic 3.5% |
| Puerto Ricans | 0.0 /100 | #273 | Tragic 3.5% |
| Swiss | 0.0 /100 | #274 | Tragic 3.5% |
| Czechoslovakians | 0.0 /100 | #275 | Tragic 3.6% |
| Danes | 0.0 /100 | #276 | Tragic 3.6% |