Kenyan vs Immigrants from Argentina Hearing Disability
COMPARE
Kenyan
Immigrants from Argentina
Hearing Disability
Hearing Disability Comparison
Kenyans
Immigrants from Argentina
2.8%
HEARING DISABILITY
89.8/ 100
METRIC RATING
119th/ 347
METRIC RANK
2.8%
HEARING DISABILITY
97.0/ 100
METRIC RATING
84th/ 347
METRIC RANK
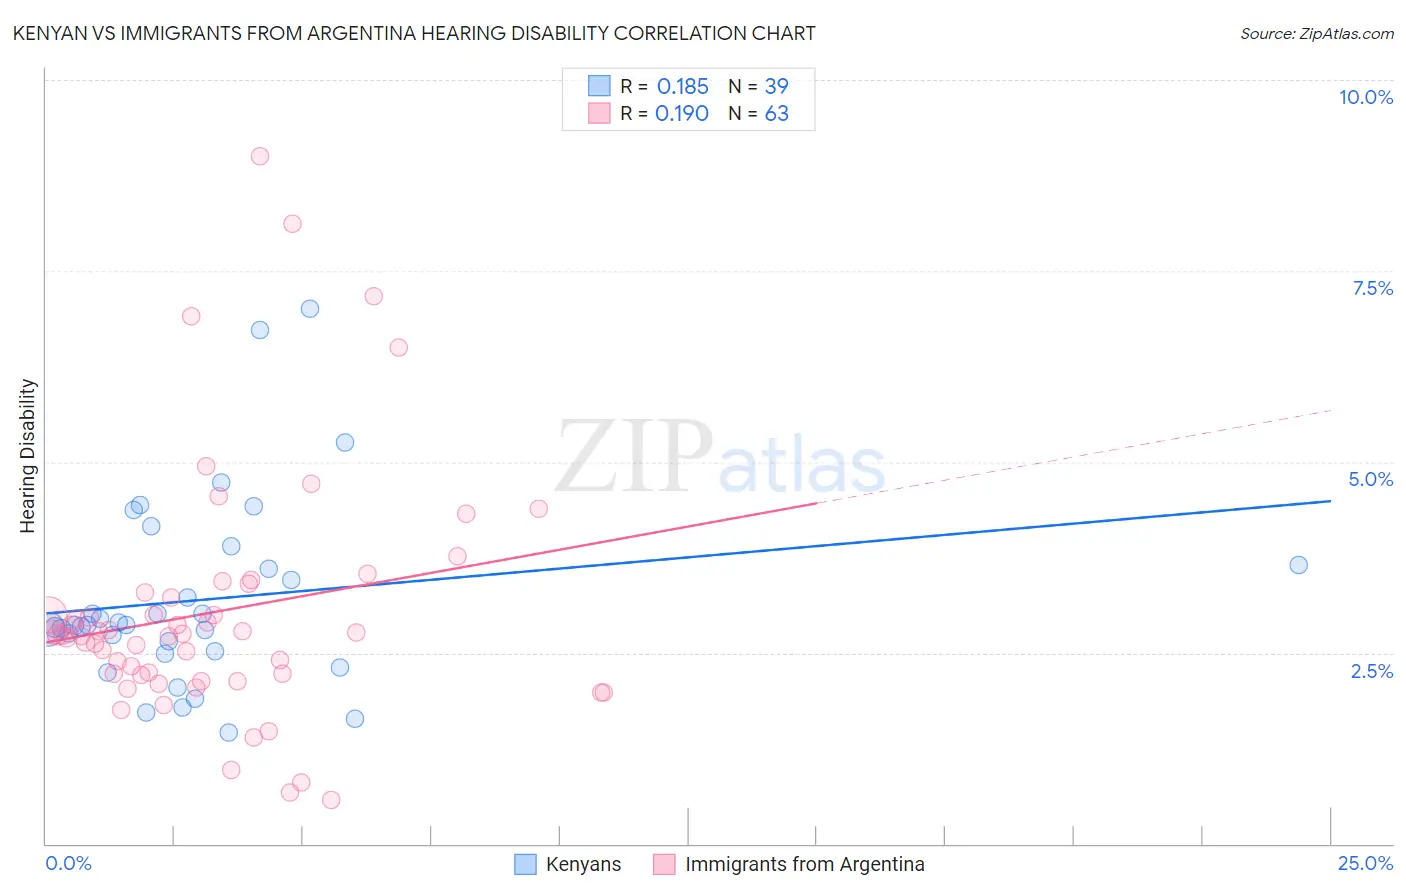
Kenyan vs Immigrants from Argentina Hearing Disability Correlation Chart
The statistical analysis conducted on geographies consisting of 168,202,963 people shows a poor positive correlation between the proportion of Kenyans and percentage of population with hearing disability in the United States with a correlation coefficient (R) of 0.185 and weighted average of 2.8%. Similarly, the statistical analysis conducted on geographies consisting of 264,393,867 people shows a poor positive correlation between the proportion of Immigrants from Argentina and percentage of population with hearing disability in the United States with a correlation coefficient (R) of 0.190 and weighted average of 2.8%, a difference of 3.3%.
Hearing Disability Correlation Summary
| Measurement | Kenyan | Immigrants from Argentina |
| Minimum | 1.5% | 0.57% |
| Maximum | 7.0% | 9.0% |
| Range | 5.6% | 8.4% |
| Mean | 3.2% | 3.0% |
| Median | 2.9% | 2.7% |
| Interquartile 25% (IQ1) | 2.5% | 2.2% |
| Interquartile 75% (IQ3) | 3.6% | 3.3% |
| Interquartile Range (IQR) | 1.1% | 1.1% |
| Standard Deviation (Sample) | 1.2% | 1.6% |
| Standard Deviation (Population) | 1.2% | 1.6% |
Similar Demographics by Hearing Disability
Demographics Similar to Kenyans by Hearing Disability
In terms of hearing disability, the demographic groups most similar to Kenyans are Zimbabwean (2.8%, a difference of 0.020%), Immigrants from Liberia (2.8%, a difference of 0.030%), Jordanian (2.8%, a difference of 0.090%), Immigrants (2.8%, a difference of 0.12%), and Cuban (2.8%, a difference of 0.12%).
| Demographics | Rating | Rank | Hearing Disability |
| U.S. Virgin Islanders | 92.5 /100 | #112 | Exceptional 2.8% |
| Immigrants | Belarus | 91.6 /100 | #113 | Exceptional 2.8% |
| Cambodians | 91.1 /100 | #114 | Exceptional 2.8% |
| Immigrants | Latin America | 90.5 /100 | #115 | Exceptional 2.8% |
| Immigrants | Immigrants | 90.3 /100 | #116 | Exceptional 2.8% |
| Immigrants | Liberia | 90.0 /100 | #117 | Excellent 2.8% |
| Zimbabweans | 89.9 /100 | #118 | Excellent 2.8% |
| Kenyans | 89.8 /100 | #119 | Excellent 2.8% |
| Jordanians | 89.5 /100 | #120 | Excellent 2.8% |
| Cubans | 89.4 /100 | #121 | Excellent 2.8% |
| Liberians | 89.0 /100 | #122 | Excellent 2.8% |
| Immigrants | Zaire | 88.6 /100 | #123 | Excellent 2.9% |
| Bahamians | 88.6 /100 | #124 | Excellent 2.9% |
| Immigrants | Albania | 88.5 /100 | #125 | Excellent 2.9% |
| Immigrants | Sudan | 87.8 /100 | #126 | Excellent 2.9% |
Demographics Similar to Immigrants from Argentina by Hearing Disability
In terms of hearing disability, the demographic groups most similar to Immigrants from Argentina are Immigrants from Northern Africa (2.8%, a difference of 0.070%), Immigrants from Iran (2.8%, a difference of 0.10%), Immigrants from Cuba (2.7%, a difference of 0.19%), Immigrants from Armenia (2.7%, a difference of 0.21%), and Somali (2.8%, a difference of 0.21%).
| Demographics | Rating | Rank | Hearing Disability |
| Immigrants | Malaysia | 97.5 /100 | #77 | Exceptional 2.7% |
| Mongolians | 97.4 /100 | #78 | Exceptional 2.7% |
| Colombians | 97.4 /100 | #79 | Exceptional 2.7% |
| Immigrants | Asia | 97.2 /100 | #80 | Exceptional 2.7% |
| Immigrants | Uruguay | 97.2 /100 | #81 | Exceptional 2.7% |
| Immigrants | Armenia | 97.2 /100 | #82 | Exceptional 2.7% |
| Immigrants | Cuba | 97.2 /100 | #83 | Exceptional 2.7% |
| Immigrants | Argentina | 97.0 /100 | #84 | Exceptional 2.8% |
| Immigrants | Northern Africa | 96.9 /100 | #85 | Exceptional 2.8% |
| Immigrants | Iran | 96.8 /100 | #86 | Exceptional 2.8% |
| Somalis | 96.7 /100 | #87 | Exceptional 2.8% |
| Immigrants | Turkey | 96.7 /100 | #88 | Exceptional 2.8% |
| Belizeans | 96.6 /100 | #89 | Exceptional 2.8% |
| Immigrants | Morocco | 96.6 /100 | #90 | Exceptional 2.8% |
| Immigrants | Middle Africa | 96.5 /100 | #91 | Exceptional 2.8% |