Latvian vs Immigrants from Argentina Hearing Disability
COMPARE
Latvian
Immigrants from Argentina
Hearing Disability
Hearing Disability Comparison
Latvians
Immigrants from Argentina
3.2%
HEARING DISABILITY
5.1/ 100
METRIC RATING
225th/ 347
METRIC RANK
2.8%
HEARING DISABILITY
97.0/ 100
METRIC RATING
84th/ 347
METRIC RANK
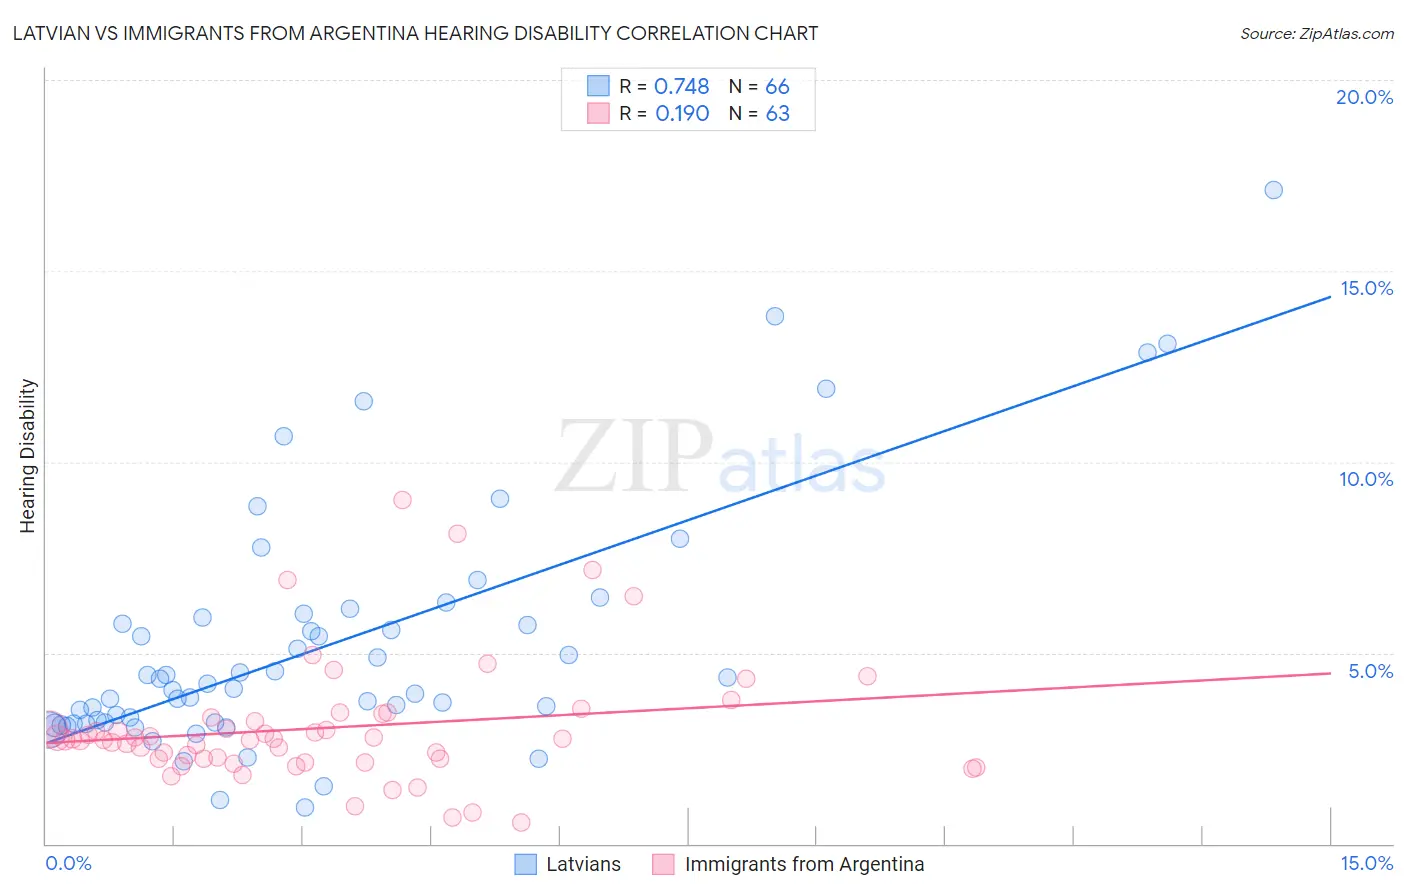
Latvian vs Immigrants from Argentina Hearing Disability Correlation Chart
The statistical analysis conducted on geographies consisting of 220,695,390 people shows a strong positive correlation between the proportion of Latvians and percentage of population with hearing disability in the United States with a correlation coefficient (R) of 0.748 and weighted average of 3.2%. Similarly, the statistical analysis conducted on geographies consisting of 264,393,867 people shows a poor positive correlation between the proportion of Immigrants from Argentina and percentage of population with hearing disability in the United States with a correlation coefficient (R) of 0.190 and weighted average of 2.8%, a difference of 16.3%.
Hearing Disability Correlation Summary
| Measurement | Latvian | Immigrants from Argentina |
| Minimum | 0.95% | 0.57% |
| Maximum | 17.1% | 9.0% |
| Range | 16.2% | 8.4% |
| Mean | 5.2% | 3.0% |
| Median | 4.1% | 2.7% |
| Interquartile 25% (IQ1) | 3.2% | 2.2% |
| Interquartile 75% (IQ3) | 5.9% | 3.3% |
| Interquartile Range (IQR) | 2.8% | 1.1% |
| Standard Deviation (Sample) | 3.2% | 1.6% |
| Standard Deviation (Population) | 3.2% | 1.6% |
Similar Demographics by Hearing Disability
Demographics Similar to Latvians by Hearing Disability
In terms of hearing disability, the demographic groups most similar to Latvians are Icelander (3.2%, a difference of 0.040%), Lebanese (3.2%, a difference of 0.040%), Mexican (3.2%, a difference of 0.21%), Bhutanese (3.2%, a difference of 0.23%), and Immigrants from Portugal (3.2%, a difference of 0.42%).
| Demographics | Rating | Rank | Hearing Disability |
| Immigrants | Northern Europe | 7.0 /100 | #218 | Tragic 3.2% |
| New Zealanders | 6.8 /100 | #219 | Tragic 3.2% |
| Malaysians | 6.6 /100 | #220 | Tragic 3.2% |
| Immigrants | Laos | 6.6 /100 | #221 | Tragic 3.2% |
| Immigrants | Oceania | 6.5 /100 | #222 | Tragic 3.2% |
| Mexicans | 5.6 /100 | #223 | Tragic 3.2% |
| Icelanders | 5.2 /100 | #224 | Tragic 3.2% |
| Latvians | 5.1 /100 | #225 | Tragic 3.2% |
| Lebanese | 5.0 /100 | #226 | Tragic 3.2% |
| Bhutanese | 4.6 /100 | #227 | Tragic 3.2% |
| Immigrants | Portugal | 4.3 /100 | #228 | Tragic 3.2% |
| Maltese | 4.1 /100 | #229 | Tragic 3.2% |
| Greeks | 3.2 /100 | #230 | Tragic 3.2% |
| Luxembourgers | 2.9 /100 | #231 | Tragic 3.2% |
| Ukrainians | 2.9 /100 | #232 | Tragic 3.2% |
Demographics Similar to Immigrants from Argentina by Hearing Disability
In terms of hearing disability, the demographic groups most similar to Immigrants from Argentina are Immigrants from Northern Africa (2.8%, a difference of 0.070%), Immigrants from Iran (2.8%, a difference of 0.10%), Immigrants from Cuba (2.7%, a difference of 0.19%), Immigrants from Armenia (2.7%, a difference of 0.21%), and Somali (2.8%, a difference of 0.21%).
| Demographics | Rating | Rank | Hearing Disability |
| Immigrants | Malaysia | 97.5 /100 | #77 | Exceptional 2.7% |
| Mongolians | 97.4 /100 | #78 | Exceptional 2.7% |
| Colombians | 97.4 /100 | #79 | Exceptional 2.7% |
| Immigrants | Asia | 97.2 /100 | #80 | Exceptional 2.7% |
| Immigrants | Uruguay | 97.2 /100 | #81 | Exceptional 2.7% |
| Immigrants | Armenia | 97.2 /100 | #82 | Exceptional 2.7% |
| Immigrants | Cuba | 97.2 /100 | #83 | Exceptional 2.7% |
| Immigrants | Argentina | 97.0 /100 | #84 | Exceptional 2.8% |
| Immigrants | Northern Africa | 96.9 /100 | #85 | Exceptional 2.8% |
| Immigrants | Iran | 96.8 /100 | #86 | Exceptional 2.8% |
| Somalis | 96.7 /100 | #87 | Exceptional 2.8% |
| Immigrants | Turkey | 96.7 /100 | #88 | Exceptional 2.8% |
| Belizeans | 96.6 /100 | #89 | Exceptional 2.8% |
| Immigrants | Morocco | 96.6 /100 | #90 | Exceptional 2.8% |
| Immigrants | Middle Africa | 96.5 /100 | #91 | Exceptional 2.8% |