Ethiopian vs Immigrants from Trinidad and Tobago Self-Care Disability
COMPARE
Ethiopian
Immigrants from Trinidad and Tobago
Self-Care Disability
Self-Care Disability Comparison
Ethiopians
Immigrants from Trinidad and Tobago
2.2%
SELF-CARE DISABILITY
100.0/ 100
METRIC RATING
13th/ 347
METRIC RANK
2.7%
SELF-CARE DISABILITY
0.1/ 100
METRIC RATING
275th/ 347
METRIC RANK
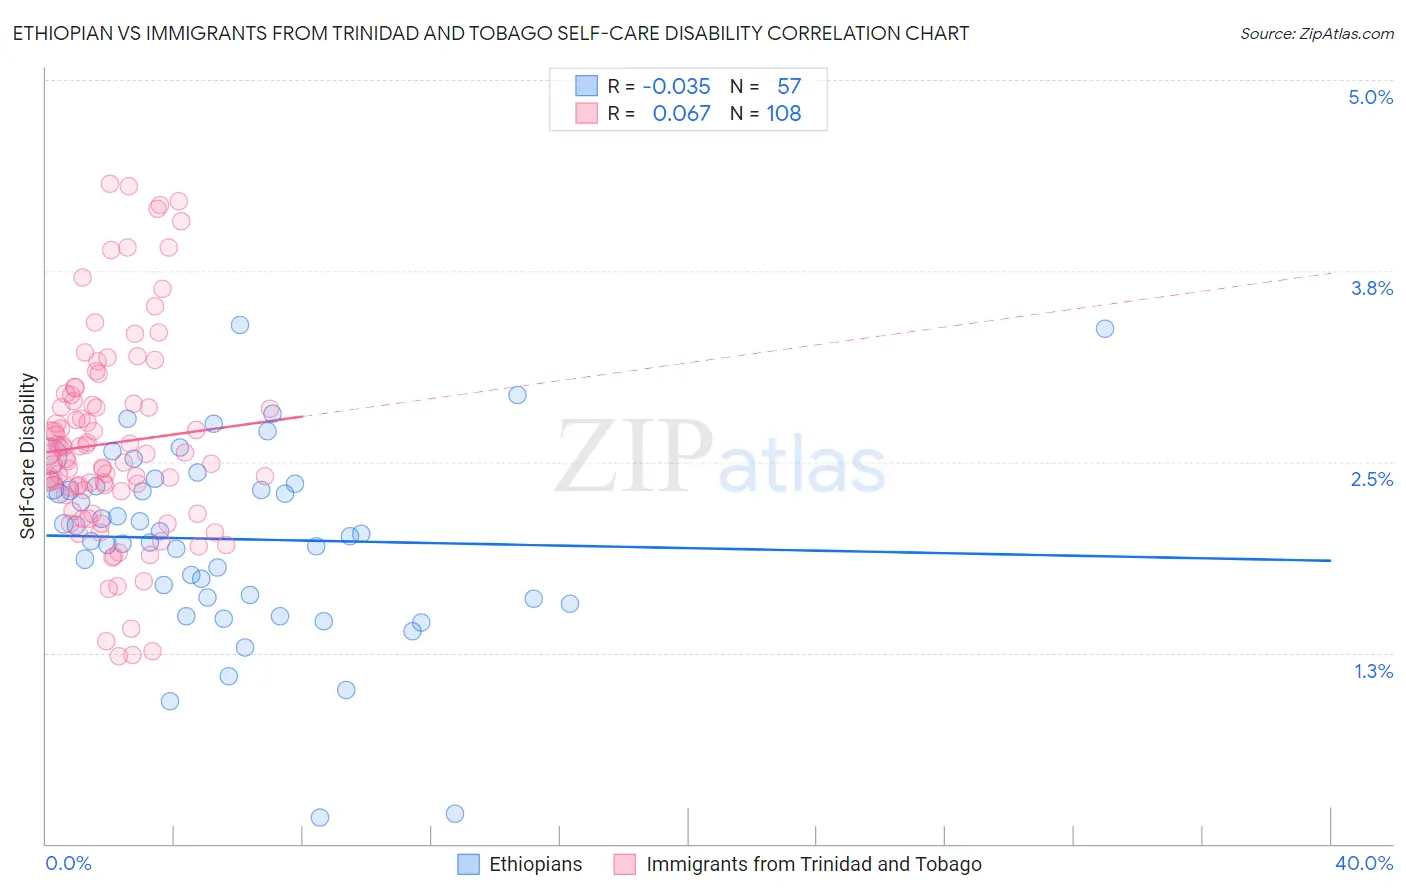
Ethiopian vs Immigrants from Trinidad and Tobago Self-Care Disability Correlation Chart
The statistical analysis conducted on geographies consisting of 223,073,982 people shows no correlation between the proportion of Ethiopians and percentage of population with self-care disability in the United States with a correlation coefficient (R) of -0.035 and weighted average of 2.2%. Similarly, the statistical analysis conducted on geographies consisting of 223,419,964 people shows a slight positive correlation between the proportion of Immigrants from Trinidad and Tobago and percentage of population with self-care disability in the United States with a correlation coefficient (R) of 0.067 and weighted average of 2.7%, a difference of 22.1%.
Self-Care Disability Correlation Summary
| Measurement | Ethiopian | Immigrants from Trinidad and Tobago |
| Minimum | 0.17% | 1.2% |
| Maximum | 3.4% | 4.3% |
| Range | 3.2% | 3.1% |
| Mean | 2.0% | 2.6% |
| Median | 2.0% | 2.6% |
| Interquartile 25% (IQ1) | 1.6% | 2.3% |
| Interquartile 75% (IQ3) | 2.3% | 2.9% |
| Interquartile Range (IQR) | 0.74% | 0.59% |
| Standard Deviation (Sample) | 0.63% | 0.66% |
| Standard Deviation (Population) | 0.63% | 0.66% |
Similar Demographics by Self-Care Disability
Demographics Similar to Ethiopians by Self-Care Disability
In terms of self-care disability, the demographic groups most similar to Ethiopians are Immigrants from Ethiopia (2.2%, a difference of 0.010%), Immigrants from South Central Asia (2.2%, a difference of 0.070%), Luxembourger (2.2%, a difference of 0.16%), Sudanese (2.2%, a difference of 0.17%), and Okinawan (2.2%, a difference of 0.17%).
| Demographics | Rating | Rank | Self-Care Disability |
| Filipinos | 100.0 /100 | #6 | Exceptional 2.2% |
| Immigrants | Bolivia | 100.0 /100 | #7 | Exceptional 2.2% |
| Bolivians | 100.0 /100 | #8 | Exceptional 2.2% |
| Immigrants | Nepal | 100.0 /100 | #9 | Exceptional 2.2% |
| Sudanese | 100.0 /100 | #10 | Exceptional 2.2% |
| Immigrants | South Central Asia | 100.0 /100 | #11 | Exceptional 2.2% |
| Immigrants | Ethiopia | 100.0 /100 | #12 | Exceptional 2.2% |
| Ethiopians | 100.0 /100 | #13 | Exceptional 2.2% |
| Luxembourgers | 100.0 /100 | #14 | Exceptional 2.2% |
| Okinawans | 100.0 /100 | #15 | Exceptional 2.2% |
| Immigrants | Kuwait | 100.0 /100 | #16 | Exceptional 2.2% |
| Immigrants | Saudi Arabia | 100.0 /100 | #17 | Exceptional 2.2% |
| Immigrants | Taiwan | 100.0 /100 | #18 | Exceptional 2.2% |
| Immigrants | Eritrea | 100.0 /100 | #19 | Exceptional 2.2% |
| Tongans | 100.0 /100 | #20 | Exceptional 2.2% |
Demographics Similar to Immigrants from Trinidad and Tobago by Self-Care Disability
In terms of self-care disability, the demographic groups most similar to Immigrants from Trinidad and Tobago are Yakama (2.7%, a difference of 0.0%), Mexican (2.7%, a difference of 0.060%), Japanese (2.7%, a difference of 0.13%), Immigrants from Ukraine (2.7%, a difference of 0.19%), and Immigrants from Laos (2.7%, a difference of 0.20%).
| Demographics | Rating | Rank | Self-Care Disability |
| Immigrants | Mexico | 0.1 /100 | #268 | Tragic 2.7% |
| U.S. Virgin Islanders | 0.1 /100 | #269 | Tragic 2.7% |
| Immigrants | Micronesia | 0.1 /100 | #270 | Tragic 2.7% |
| Trinidadians and Tobagonians | 0.1 /100 | #271 | Tragic 2.7% |
| Immigrants | Laos | 0.1 /100 | #272 | Tragic 2.7% |
| Mexicans | 0.1 /100 | #273 | Tragic 2.7% |
| Yakama | 0.1 /100 | #274 | Tragic 2.7% |
| Immigrants | Trinidad and Tobago | 0.1 /100 | #275 | Tragic 2.7% |
| Japanese | 0.1 /100 | #276 | Tragic 2.7% |
| Immigrants | Ukraine | 0.1 /100 | #277 | Tragic 2.7% |
| Ottawa | 0.1 /100 | #278 | Tragic 2.7% |
| Iroquois | 0.1 /100 | #279 | Tragic 2.7% |
| Hispanics or Latinos | 0.1 /100 | #280 | Tragic 2.7% |
| Immigrants | Iraq | 0.0 /100 | #281 | Tragic 2.7% |
| Apache | 0.0 /100 | #282 | Tragic 2.7% |