Immigrants from Middle Africa vs Creek Disability
COMPARE
Immigrants from Middle Africa
Creek
Disability
Disability Comparison
Immigrants from Middle Africa
Creek
11.6%
DISABILITY
69.5/ 100
METRIC RATING
157th/ 347
METRIC RANK
15.6%
DISABILITY
0.0/ 100
METRIC RATING
343rd/ 347
METRIC RANK
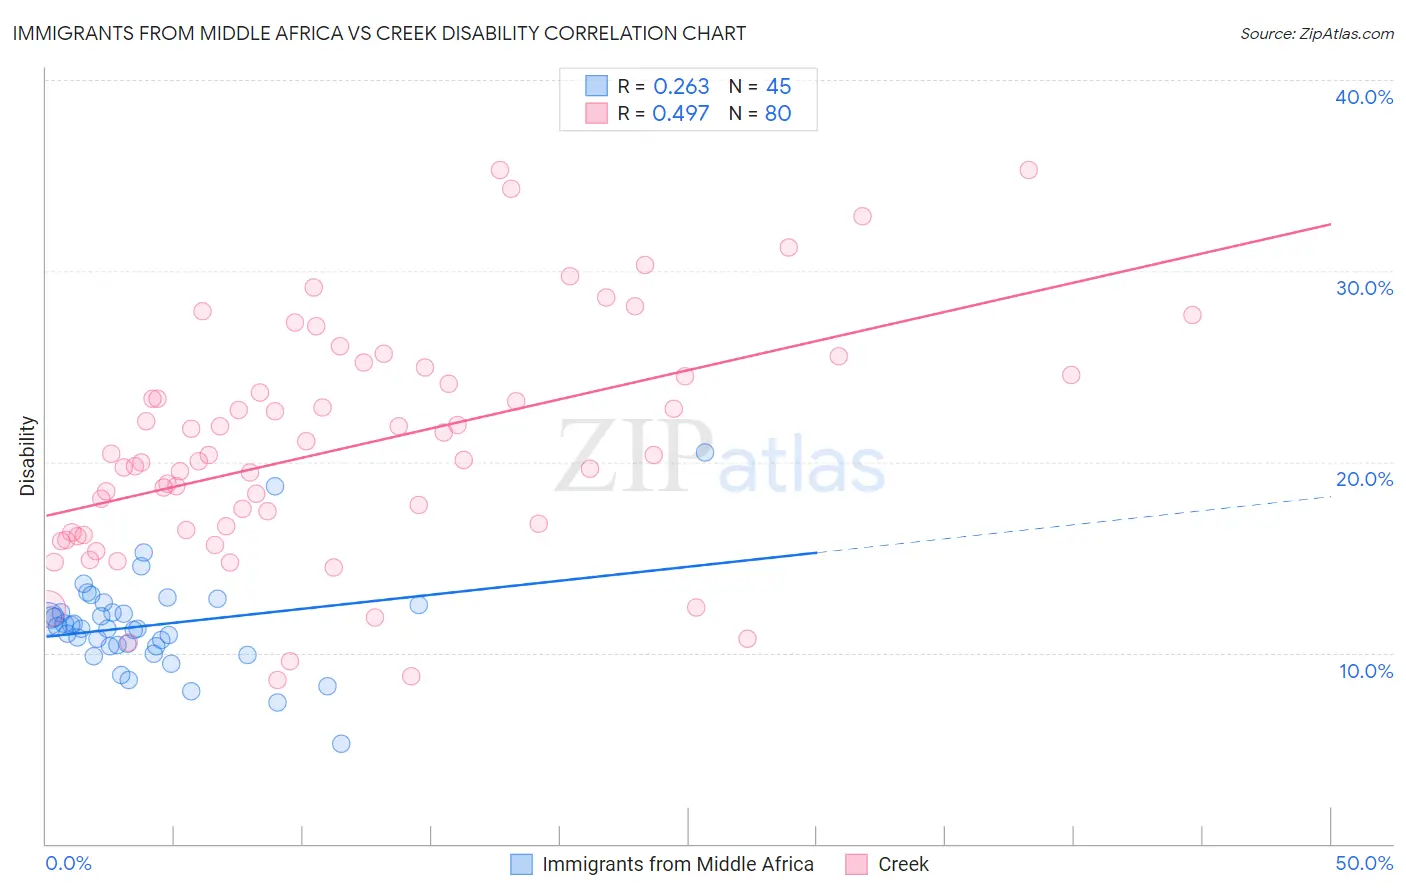
Immigrants from Middle Africa vs Creek Disability Correlation Chart
The statistical analysis conducted on geographies consisting of 202,728,715 people shows a weak positive correlation between the proportion of Immigrants from Middle Africa and percentage of population with a disability in the United States with a correlation coefficient (R) of 0.263 and weighted average of 11.6%. Similarly, the statistical analysis conducted on geographies consisting of 178,460,797 people shows a moderate positive correlation between the proportion of Creek and percentage of population with a disability in the United States with a correlation coefficient (R) of 0.497 and weighted average of 15.6%, a difference of 34.5%.
Disability Correlation Summary
| Measurement | Immigrants from Middle Africa | Creek |
| Minimum | 5.2% | 8.6% |
| Maximum | 20.5% | 35.3% |
| Range | 15.3% | 26.7% |
| Mean | 11.4% | 20.8% |
| Median | 11.3% | 20.2% |
| Interquartile 25% (IQ1) | 10.3% | 16.4% |
| Interquartile 75% (IQ3) | 12.3% | 24.5% |
| Interquartile Range (IQR) | 2.0% | 8.1% |
| Standard Deviation (Sample) | 2.6% | 6.1% |
| Standard Deviation (Population) | 2.5% | 6.0% |
Similar Demographics by Disability
Demographics Similar to Immigrants from Middle Africa by Disability
In terms of disability, the demographic groups most similar to Immigrants from Middle Africa are Immigrants from Fiji (11.6%, a difference of 0.0%), Immigrants from Netherlands (11.6%, a difference of 0.020%), Immigrants from Ghana (11.6%, a difference of 0.090%), Immigrants from Guatemala (11.6%, a difference of 0.090%), and Immigrants from Kenya (11.6%, a difference of 0.14%).
| Demographics | Rating | Rank | Disability |
| Romanians | 72.7 /100 | #150 | Good 11.6% |
| Immigrants | Kenya | 72.1 /100 | #151 | Good 11.6% |
| Immigrants | Moldova | 72.0 /100 | #152 | Good 11.6% |
| Immigrants | Ghana | 71.2 /100 | #153 | Good 11.6% |
| Immigrants | Guatemala | 71.1 /100 | #154 | Good 11.6% |
| Immigrants | Netherlands | 69.8 /100 | #155 | Good 11.6% |
| Immigrants | Fiji | 69.5 /100 | #156 | Good 11.6% |
| Immigrants | Middle Africa | 69.5 /100 | #157 | Good 11.6% |
| Armenians | 65.9 /100 | #158 | Good 11.6% |
| Guatemalans | 65.1 /100 | #159 | Good 11.6% |
| Immigrants | Barbados | 64.2 /100 | #160 | Good 11.6% |
| Immigrants | Cuba | 62.8 /100 | #161 | Good 11.6% |
| Immigrants | Haiti | 59.2 /100 | #162 | Average 11.7% |
| Immigrants | Trinidad and Tobago | 58.9 /100 | #163 | Average 11.7% |
| Syrians | 58.5 /100 | #164 | Average 11.7% |
Demographics Similar to Creek by Disability
In terms of disability, the demographic groups most similar to Creek are Kiowa (15.6%, a difference of 0.010%), Lumbee (15.5%, a difference of 0.47%), Colville (15.8%, a difference of 1.2%), Choctaw (15.4%, a difference of 1.3%), and Chickasaw (15.2%, a difference of 2.8%).
| Demographics | Rating | Rank | Disability |
| Cajuns | 0.0 /100 | #333 | Tragic 14.6% |
| Yuman | 0.0 /100 | #334 | Tragic 14.6% |
| Tohono O'odham | 0.0 /100 | #335 | Tragic 14.8% |
| Cherokee | 0.0 /100 | #336 | Tragic 14.8% |
| Seminole | 0.0 /100 | #337 | Tragic 14.9% |
| Dutch West Indians | 0.0 /100 | #338 | Tragic 14.9% |
| Chickasaw | 0.0 /100 | #339 | Tragic 15.2% |
| Choctaw | 0.0 /100 | #340 | Tragic 15.4% |
| Lumbee | 0.0 /100 | #341 | Tragic 15.5% |
| Kiowa | 0.0 /100 | #342 | Tragic 15.6% |
| Creek | 0.0 /100 | #343 | Tragic 15.6% |
| Colville | 0.0 /100 | #344 | Tragic 15.8% |
| Puerto Ricans | 0.0 /100 | #345 | Tragic 16.1% |
| Tsimshian | 0.0 /100 | #346 | Tragic 16.1% |
| Houma | 0.0 /100 | #347 | Tragic 17.1% |