Immigrants from Poland vs Creek Median Earnings
COMPARE
Immigrants from Poland
Creek
Median Earnings
Median Earnings Comparison
Immigrants from Poland
Creek
$49,633
MEDIAN EARNINGS
98.9/ 100
METRIC RATING
100th/ 347
METRIC RANK
$39,648
MEDIAN EARNINGS
0.0/ 100
METRIC RATING
325th/ 347
METRIC RANK
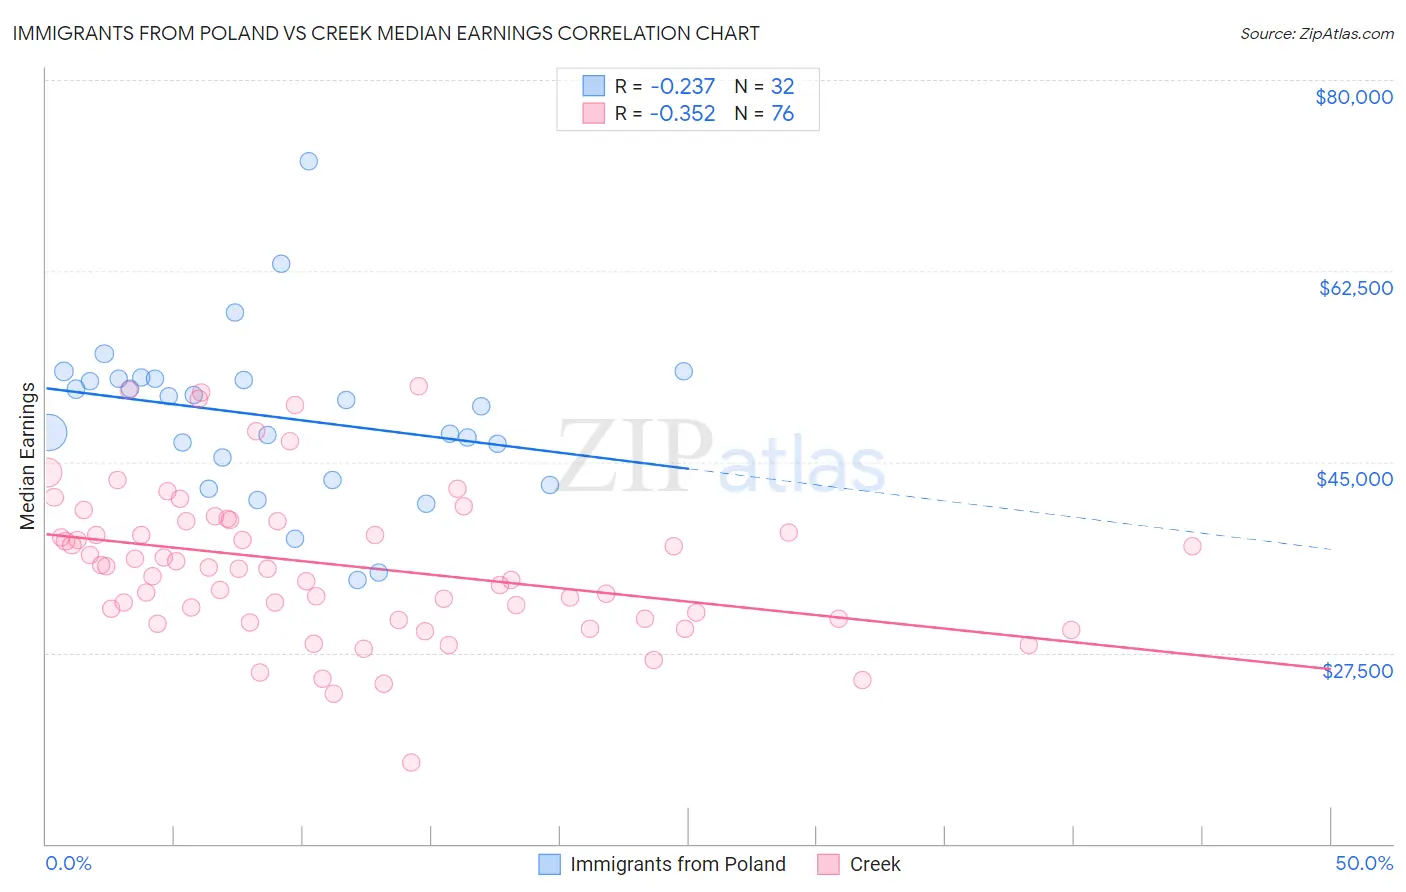
Immigrants from Poland vs Creek Median Earnings Correlation Chart
The statistical analysis conducted on geographies consisting of 304,849,071 people shows a weak negative correlation between the proportion of Immigrants from Poland and median earnings in the United States with a correlation coefficient (R) of -0.237 and weighted average of $49,633. Similarly, the statistical analysis conducted on geographies consisting of 178,470,234 people shows a mild negative correlation between the proportion of Creek and median earnings in the United States with a correlation coefficient (R) of -0.352 and weighted average of $39,648, a difference of 25.2%.
Median Earnings Correlation Summary
| Measurement | Immigrants from Poland | Creek |
| Minimum | $34,220 | $17,500 |
| Maximum | $72,500 | $51,875 |
| Range | $38,280 | $34,375 |
| Mean | $49,130 | $35,536 |
| Median | $50,398 | $35,262 |
| Interquartile 25% (IQ1) | $44,359 | $30,664 |
| Interquartile 75% (IQ3) | $52,592 | $39,531 |
| Interquartile Range (IQR) | $8,233 | $8,868 |
| Standard Deviation (Sample) | $7,639 | $6,944 |
| Standard Deviation (Population) | $7,518 | $6,899 |
Similar Demographics by Median Earnings
Demographics Similar to Immigrants from Poland by Median Earnings
In terms of median earnings, the demographic groups most similar to Immigrants from Poland are Jordanian ($49,632, a difference of 0.0%), Immigrants from Afghanistan ($49,645, a difference of 0.020%), Immigrants from Northern Africa ($49,648, a difference of 0.030%), Immigrants from North Macedonia ($49,658, a difference of 0.050%), and Immigrants from Lebanon ($49,682, a difference of 0.10%).
| Demographics | Rating | Rank | Median Earnings |
| Armenians | 99.1 /100 | #93 | Exceptional $49,804 |
| Croatians | 99.0 /100 | #94 | Exceptional $49,724 |
| Immigrants | England | 99.0 /100 | #95 | Exceptional $49,722 |
| Immigrants | Lebanon | 99.0 /100 | #96 | Exceptional $49,682 |
| Immigrants | North Macedonia | 98.9 /100 | #97 | Exceptional $49,658 |
| Immigrants | Northern Africa | 98.9 /100 | #98 | Exceptional $49,648 |
| Immigrants | Afghanistan | 98.9 /100 | #99 | Exceptional $49,645 |
| Immigrants | Poland | 98.9 /100 | #100 | Exceptional $49,633 |
| Jordanians | 98.9 /100 | #101 | Exceptional $49,632 |
| Ethiopians | 98.8 /100 | #102 | Exceptional $49,572 |
| Austrians | 98.7 /100 | #103 | Exceptional $49,501 |
| Immigrants | Brazil | 98.6 /100 | #104 | Exceptional $49,463 |
| Immigrants | Western Asia | 98.4 /100 | #105 | Exceptional $49,389 |
| Immigrants | Albania | 98.4 /100 | #106 | Exceptional $49,377 |
| Immigrants | Morocco | 98.4 /100 | #107 | Exceptional $49,368 |
Demographics Similar to Creek by Median Earnings
In terms of median earnings, the demographic groups most similar to Creek are Ottawa ($39,721, a difference of 0.18%), Bahamian ($39,735, a difference of 0.22%), Immigrants from Yemen ($39,540, a difference of 0.27%), Immigrants from Central America ($39,762, a difference of 0.29%), and Yuman ($39,523, a difference of 0.32%).
| Demographics | Rating | Rank | Median Earnings |
| Dutch West Indians | 0.0 /100 | #318 | Tragic $40,107 |
| Blacks/African Americans | 0.0 /100 | #319 | Tragic $40,085 |
| Immigrants | Bahamas | 0.0 /100 | #320 | Tragic $39,861 |
| Mexicans | 0.0 /100 | #321 | Tragic $39,834 |
| Immigrants | Central America | 0.0 /100 | #322 | Tragic $39,762 |
| Bahamians | 0.0 /100 | #323 | Tragic $39,735 |
| Ottawa | 0.0 /100 | #324 | Tragic $39,721 |
| Creek | 0.0 /100 | #325 | Tragic $39,648 |
| Immigrants | Yemen | 0.0 /100 | #326 | Tragic $39,540 |
| Yuman | 0.0 /100 | #327 | Tragic $39,523 |
| Sioux | 0.0 /100 | #328 | Tragic $39,448 |
| Kiowa | 0.0 /100 | #329 | Tragic $39,232 |
| Immigrants | Congo | 0.0 /100 | #330 | Tragic $39,169 |
| Immigrants | Mexico | 0.0 /100 | #331 | Tragic $39,114 |
| Yakama | 0.0 /100 | #332 | Tragic $39,107 |