Ukrainian vs Creek Disability
COMPARE
Ukrainian
Creek
Disability
Disability Comparison
Ukrainians
Creek
11.9%
DISABILITY
14.7/ 100
METRIC RATING
198th/ 347
METRIC RANK
15.6%
DISABILITY
0.0/ 100
METRIC RATING
343rd/ 347
METRIC RANK
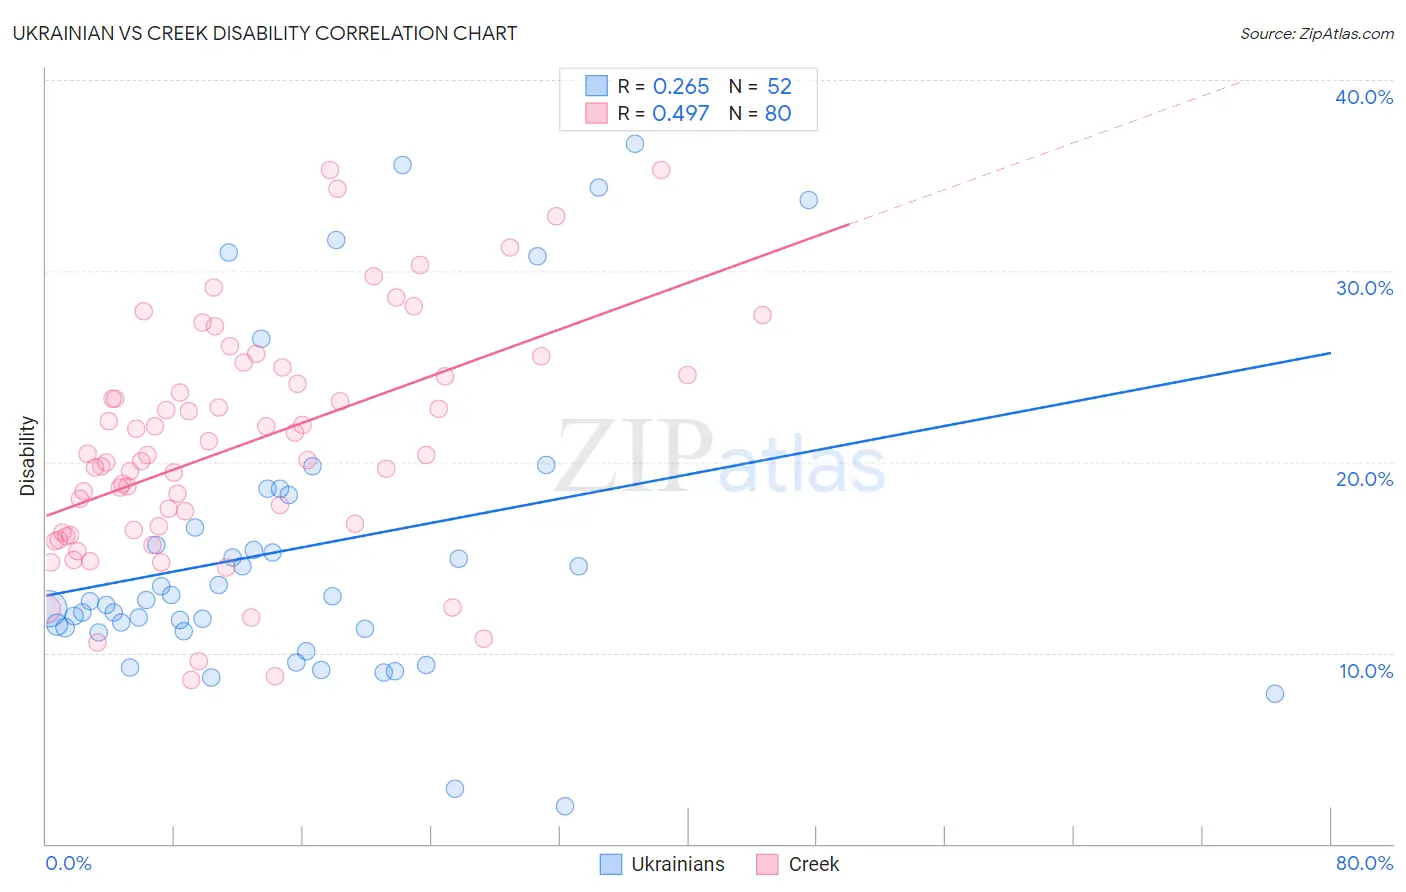
Ukrainian vs Creek Disability Correlation Chart
The statistical analysis conducted on geographies consisting of 448,640,628 people shows a weak positive correlation between the proportion of Ukrainians and percentage of population with a disability in the United States with a correlation coefficient (R) of 0.265 and weighted average of 11.9%. Similarly, the statistical analysis conducted on geographies consisting of 178,460,797 people shows a moderate positive correlation between the proportion of Creek and percentage of population with a disability in the United States with a correlation coefficient (R) of 0.497 and weighted average of 15.6%, a difference of 30.8%.
Disability Correlation Summary
| Measurement | Ukrainian | Creek |
| Minimum | 1.9% | 8.6% |
| Maximum | 36.7% | 35.3% |
| Range | 34.7% | 26.7% |
| Mean | 15.5% | 20.8% |
| Median | 12.7% | 20.2% |
| Interquartile 25% (IQ1) | 11.2% | 16.4% |
| Interquartile 75% (IQ3) | 17.4% | 24.5% |
| Interquartile Range (IQR) | 6.2% | 8.1% |
| Standard Deviation (Sample) | 8.2% | 6.1% |
| Standard Deviation (Population) | 8.1% | 6.0% |
Similar Demographics by Disability
Demographics Similar to Ukrainians by Disability
In terms of disability, the demographic groups most similar to Ukrainians are Immigrants from Panama (11.9%, a difference of 0.010%), Immigrants from Belize (11.9%, a difference of 0.050%), Serbian (11.9%, a difference of 0.060%), Barbadian (11.9%, a difference of 0.10%), and Belizean (11.9%, a difference of 0.17%).
| Demographics | Rating | Rank | Disability |
| Ute | 19.5 /100 | #191 | Poor 11.9% |
| Lithuanians | 18.8 /100 | #192 | Poor 11.9% |
| Immigrants | Bosnia and Herzegovina | 18.0 /100 | #193 | Poor 11.9% |
| Somalis | 17.3 /100 | #194 | Poor 11.9% |
| Barbadians | 15.8 /100 | #195 | Poor 11.9% |
| Serbians | 15.4 /100 | #196 | Poor 11.9% |
| Immigrants | Belize | 15.2 /100 | #197 | Poor 11.9% |
| Ukrainians | 14.7 /100 | #198 | Poor 11.9% |
| Immigrants | Panama | 14.6 /100 | #199 | Poor 11.9% |
| Belizeans | 12.8 /100 | #200 | Poor 11.9% |
| Assyrians/Chaldeans/Syriacs | 12.6 /100 | #201 | Poor 11.9% |
| Immigrants | England | 12.0 /100 | #202 | Poor 12.0% |
| British West Indians | 11.5 /100 | #203 | Poor 12.0% |
| Mexican American Indians | 11.4 /100 | #204 | Poor 12.0% |
| Immigrants | Western Europe | 10.1 /100 | #205 | Poor 12.0% |
Demographics Similar to Creek by Disability
In terms of disability, the demographic groups most similar to Creek are Kiowa (15.6%, a difference of 0.010%), Lumbee (15.5%, a difference of 0.47%), Colville (15.8%, a difference of 1.2%), Choctaw (15.4%, a difference of 1.3%), and Chickasaw (15.2%, a difference of 2.8%).
| Demographics | Rating | Rank | Disability |
| Cajuns | 0.0 /100 | #333 | Tragic 14.6% |
| Yuman | 0.0 /100 | #334 | Tragic 14.6% |
| Tohono O'odham | 0.0 /100 | #335 | Tragic 14.8% |
| Cherokee | 0.0 /100 | #336 | Tragic 14.8% |
| Seminole | 0.0 /100 | #337 | Tragic 14.9% |
| Dutch West Indians | 0.0 /100 | #338 | Tragic 14.9% |
| Chickasaw | 0.0 /100 | #339 | Tragic 15.2% |
| Choctaw | 0.0 /100 | #340 | Tragic 15.4% |
| Lumbee | 0.0 /100 | #341 | Tragic 15.5% |
| Kiowa | 0.0 /100 | #342 | Tragic 15.6% |
| Creek | 0.0 /100 | #343 | Tragic 15.6% |
| Colville | 0.0 /100 | #344 | Tragic 15.8% |
| Puerto Ricans | 0.0 /100 | #345 | Tragic 16.1% |
| Tsimshian | 0.0 /100 | #346 | Tragic 16.1% |
| Houma | 0.0 /100 | #347 | Tragic 17.1% |