Immigrants from Philippines vs Cambodian Hearing Disability
COMPARE
Immigrants from Philippines
Cambodian
Hearing Disability
Hearing Disability Comparison
Immigrants from Philippines
Cambodians
3.0%
HEARING DISABILITY
46.4/ 100
METRIC RATING
177th/ 347
METRIC RANK
2.8%
HEARING DISABILITY
91.1/ 100
METRIC RATING
114th/ 347
METRIC RANK
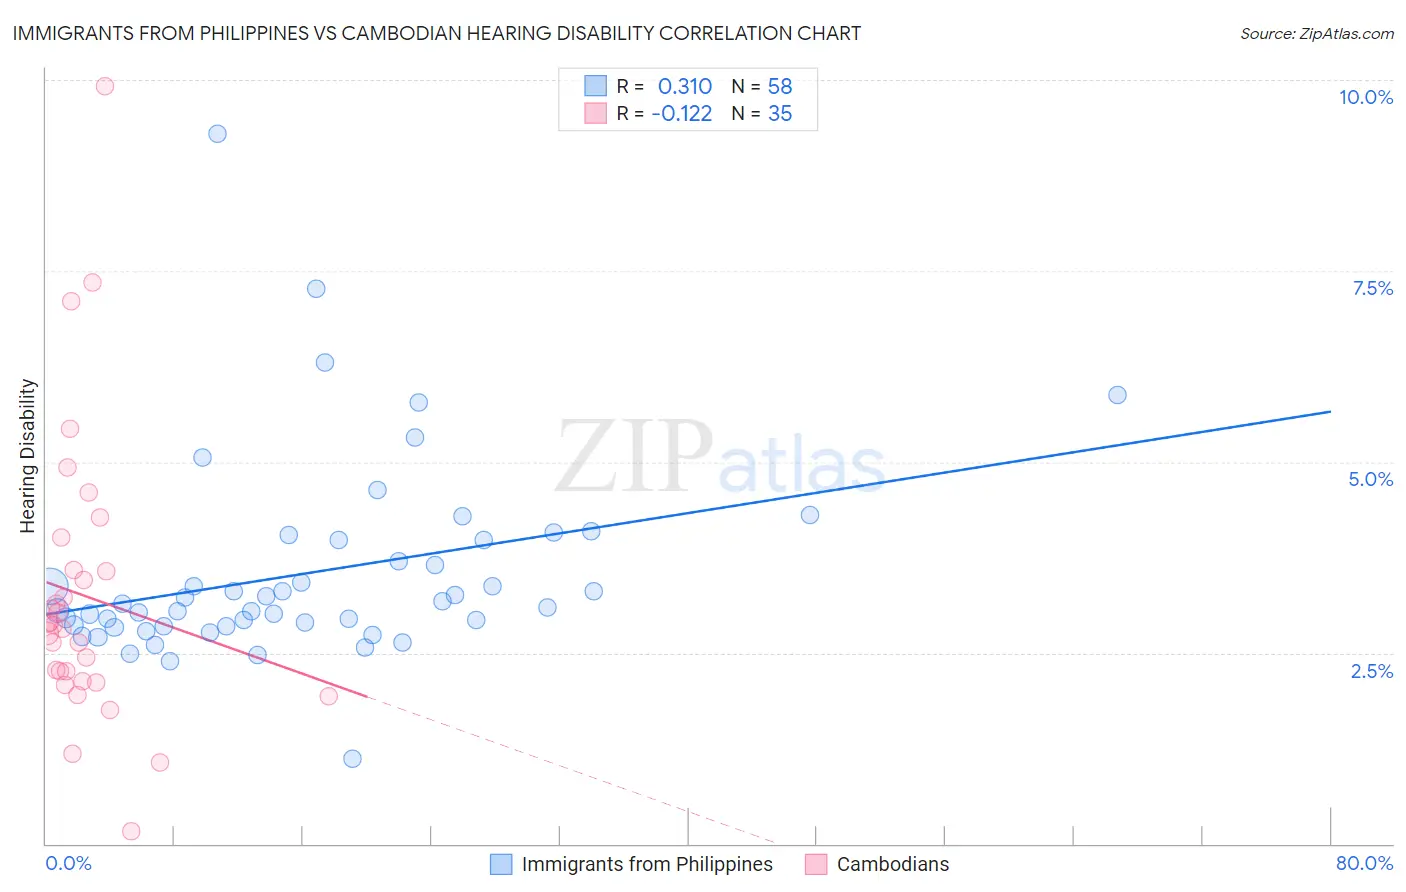
Immigrants from Philippines vs Cambodian Hearing Disability Correlation Chart
The statistical analysis conducted on geographies consisting of 471,004,648 people shows a mild positive correlation between the proportion of Immigrants from Philippines and percentage of population with hearing disability in the United States with a correlation coefficient (R) of 0.310 and weighted average of 3.0%. Similarly, the statistical analysis conducted on geographies consisting of 102,495,279 people shows a poor negative correlation between the proportion of Cambodians and percentage of population with hearing disability in the United States with a correlation coefficient (R) of -0.122 and weighted average of 2.8%, a difference of 6.1%.
Hearing Disability Correlation Summary
| Measurement | Immigrants from Philippines | Cambodian |
| Minimum | 1.1% | 0.17% |
| Maximum | 9.3% | 9.9% |
| Range | 8.2% | 9.7% |
| Mean | 3.5% | 3.3% |
| Median | 3.1% | 2.9% |
| Interquartile 25% (IQ1) | 2.8% | 2.1% |
| Interquartile 75% (IQ3) | 4.0% | 3.6% |
| Interquartile Range (IQR) | 1.1% | 1.4% |
| Standard Deviation (Sample) | 1.3% | 1.9% |
| Standard Deviation (Population) | 1.3% | 1.9% |
Similar Demographics by Hearing Disability
Demographics Similar to Immigrants from Philippines by Hearing Disability
In terms of hearing disability, the demographic groups most similar to Immigrants from Philippines are Japanese (3.0%, a difference of 0.040%), Panamanian (3.0%, a difference of 0.060%), Immigrants from Romania (3.0%, a difference of 0.20%), Immigrants from Moldova (3.0%, a difference of 0.31%), and Indonesian (3.0%, a difference of 0.34%).
| Demographics | Rating | Rank | Hearing Disability |
| Immigrants | Cabo Verde | 56.9 /100 | #170 | Average 3.0% |
| Immigrants | Ukraine | 56.6 /100 | #171 | Average 3.0% |
| Armenians | 56.0 /100 | #172 | Average 3.0% |
| Immigrants | Serbia | 51.1 /100 | #173 | Average 3.0% |
| Indonesians | 50.0 /100 | #174 | Average 3.0% |
| Immigrants | Romania | 48.4 /100 | #175 | Average 3.0% |
| Panamanians | 47.0 /100 | #176 | Average 3.0% |
| Immigrants | Philippines | 46.4 /100 | #177 | Average 3.0% |
| Japanese | 46.0 /100 | #178 | Average 3.0% |
| Immigrants | Moldova | 43.1 /100 | #179 | Average 3.0% |
| Immigrants | Sweden | 42.4 /100 | #180 | Average 3.0% |
| Immigrants | Belgium | 41.5 /100 | #181 | Average 3.0% |
| Immigrants | Italy | 41.1 /100 | #182 | Average 3.0% |
| Bulgarians | 39.7 /100 | #183 | Fair 3.0% |
| Immigrants | Ireland | 37.4 /100 | #184 | Fair 3.0% |
Demographics Similar to Cambodians by Hearing Disability
In terms of hearing disability, the demographic groups most similar to Cambodians are Immigrants from Belarus (2.8%, a difference of 0.17%), Immigrants from Latin America (2.8%, a difference of 0.17%), Immigrants (2.8%, a difference of 0.24%), Immigrants from Liberia (2.8%, a difference of 0.32%), and Zimbabwean (2.8%, a difference of 0.34%).
| Demographics | Rating | Rank | Hearing Disability |
| Immigrants | Chile | 93.4 /100 | #107 | Exceptional 2.8% |
| Guatemalans | 93.2 /100 | #108 | Exceptional 2.8% |
| Turks | 93.0 /100 | #109 | Exceptional 2.8% |
| Cypriots | 92.9 /100 | #110 | Exceptional 2.8% |
| Immigrants | Yemen | 92.7 /100 | #111 | Exceptional 2.8% |
| U.S. Virgin Islanders | 92.5 /100 | #112 | Exceptional 2.8% |
| Immigrants | Belarus | 91.6 /100 | #113 | Exceptional 2.8% |
| Cambodians | 91.1 /100 | #114 | Exceptional 2.8% |
| Immigrants | Latin America | 90.5 /100 | #115 | Exceptional 2.8% |
| Immigrants | Immigrants | 90.3 /100 | #116 | Exceptional 2.8% |
| Immigrants | Liberia | 90.0 /100 | #117 | Excellent 2.8% |
| Zimbabweans | 89.9 /100 | #118 | Excellent 2.8% |
| Kenyans | 89.8 /100 | #119 | Excellent 2.8% |
| Jordanians | 89.5 /100 | #120 | Excellent 2.8% |
| Cubans | 89.4 /100 | #121 | Excellent 2.8% |