Immigrants from Bolivia vs German Russian Disability Age Under 5
COMPARE
Immigrants from Bolivia
German Russian
Disability Age Under 5
Disability Age Under 5 Comparison
Immigrants from Bolivia
German Russians
1.1%
DISABILITY AGE UNDER 5
99.6/ 100
METRIC RATING
52nd/ 347
METRIC RANK
1.6%
DISABILITY AGE UNDER 5
0.0/ 100
METRIC RATING
301st/ 347
METRIC RANK
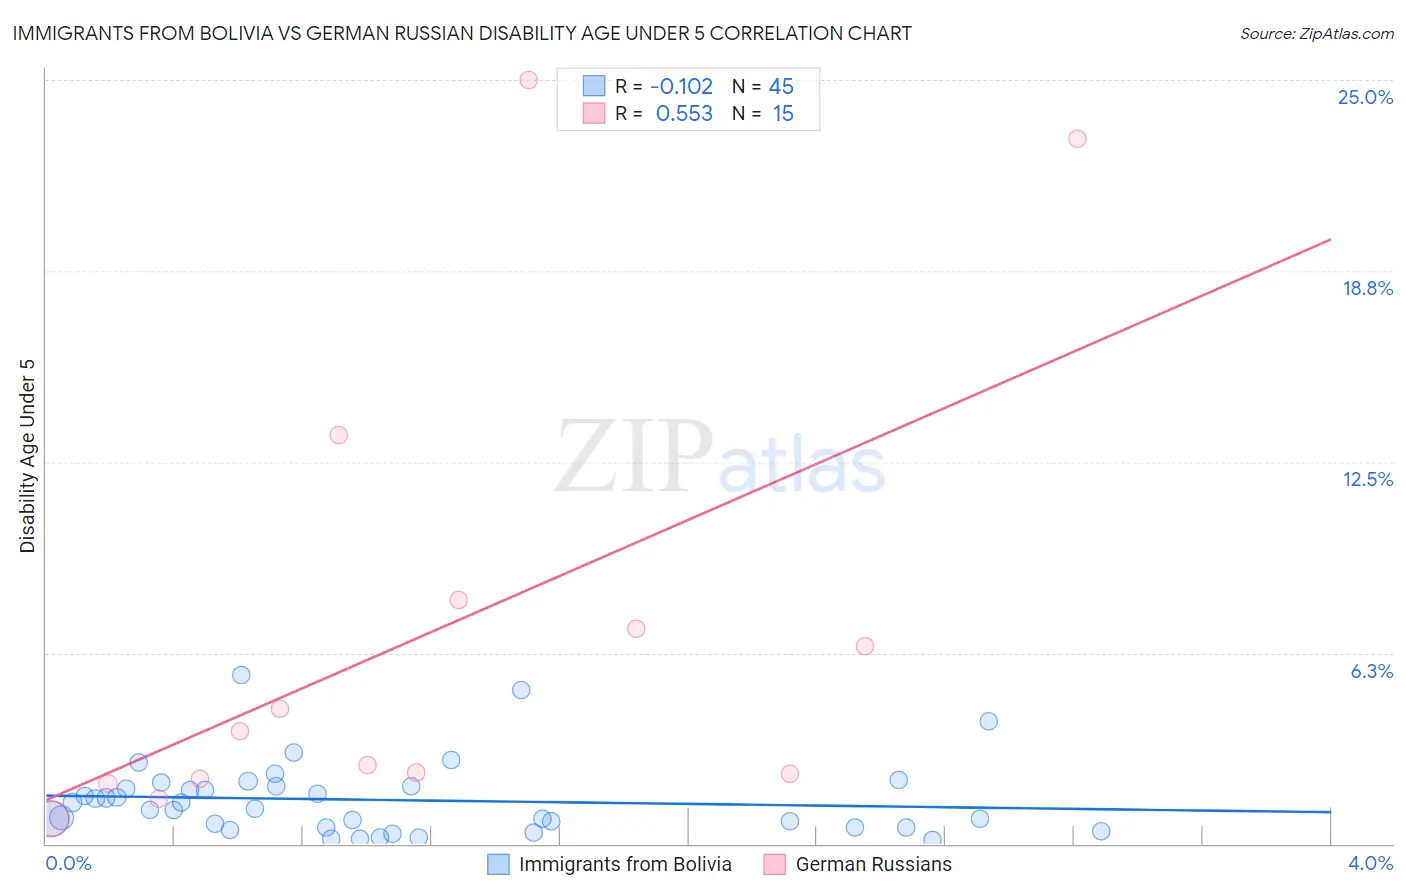
Immigrants from Bolivia vs German Russian Disability Age Under 5 Correlation Chart
The statistical analysis conducted on geographies consisting of 110,789,799 people shows a poor negative correlation between the proportion of Immigrants from Bolivia and percentage of population with a disability under the age of 5 in the United States with a correlation coefficient (R) of -0.102 and weighted average of 1.1%. Similarly, the statistical analysis conducted on geographies consisting of 78,222,474 people shows a substantial positive correlation between the proportion of German Russians and percentage of population with a disability under the age of 5 in the United States with a correlation coefficient (R) of 0.553 and weighted average of 1.6%, a difference of 50.5%.
Disability Age Under 5 Correlation Summary
| Measurement | Immigrants from Bolivia | German Russian |
| Minimum | 0.13% | 0.81% |
| Maximum | 5.5% | 25.0% |
| Range | 5.4% | 24.2% |
| Mean | 1.4% | 7.0% |
| Median | 1.1% | 3.7% |
| Interquartile 25% (IQ1) | 0.53% | 2.1% |
| Interquartile 75% (IQ3) | 1.9% | 8.0% |
| Interquartile Range (IQR) | 1.3% | 5.8% |
| Standard Deviation (Sample) | 1.2% | 7.7% |
| Standard Deviation (Population) | 1.2% | 7.4% |
Similar Demographics by Disability Age Under 5
Demographics Similar to Immigrants from Bolivia by Disability Age Under 5
In terms of disability age under 5, the demographic groups most similar to Immigrants from Bolivia are Asian (1.1%, a difference of 0.31%), Immigrants from Kazakhstan (1.1%, a difference of 0.42%), Immigrants from El Salvador (1.1%, a difference of 0.60%), Immigrants from Japan (1.1%, a difference of 0.61%), and Immigrants from Russia (1.1%, a difference of 0.63%).
| Demographics | Rating | Rank | Disability Age Under 5 |
| Immigrants | Turkey | 99.8 /100 | #45 | Exceptional 1.1% |
| Immigrants | Congo | 99.8 /100 | #46 | Exceptional 1.1% |
| Immigrants | Sweden | 99.8 /100 | #47 | Exceptional 1.1% |
| Immigrants | Singapore | 99.7 /100 | #48 | Exceptional 1.1% |
| Immigrants | Russia | 99.7 /100 | #49 | Exceptional 1.1% |
| Immigrants | Japan | 99.7 /100 | #50 | Exceptional 1.1% |
| Immigrants | Kazakhstan | 99.7 /100 | #51 | Exceptional 1.1% |
| Immigrants | Bolivia | 99.6 /100 | #52 | Exceptional 1.1% |
| Asians | 99.6 /100 | #53 | Exceptional 1.1% |
| Immigrants | El Salvador | 99.6 /100 | #54 | Exceptional 1.1% |
| Salvadorans | 99.5 /100 | #55 | Exceptional 1.1% |
| Ecuadorians | 99.5 /100 | #56 | Exceptional 1.1% |
| Assyrians/Chaldeans/Syriacs | 99.5 /100 | #57 | Exceptional 1.1% |
| Immigrants | Egypt | 99.4 /100 | #58 | Exceptional 1.1% |
| Immigrants | Malaysia | 99.4 /100 | #59 | Exceptional 1.1% |
Demographics Similar to German Russians by Disability Age Under 5
In terms of disability age under 5, the demographic groups most similar to German Russians are Welsh (1.6%, a difference of 0.12%), Swiss (1.6%, a difference of 0.27%), Shoshone (1.6%, a difference of 0.44%), Portuguese (1.6%, a difference of 0.78%), and Seminole (1.6%, a difference of 0.91%).
| Demographics | Rating | Rank | Disability Age Under 5 |
| Swedes | 0.0 /100 | #294 | Tragic 1.6% |
| Finns | 0.0 /100 | #295 | Tragic 1.6% |
| Poles | 0.0 /100 | #296 | Tragic 1.6% |
| Immigrants | Nonimmigrants | 0.0 /100 | #297 | Tragic 1.6% |
| Cajuns | 0.0 /100 | #298 | Tragic 1.6% |
| Portuguese | 0.0 /100 | #299 | Tragic 1.6% |
| Shoshone | 0.0 /100 | #300 | Tragic 1.6% |
| German Russians | 0.0 /100 | #301 | Tragic 1.6% |
| Welsh | 0.0 /100 | #302 | Tragic 1.6% |
| Swiss | 0.0 /100 | #303 | Tragic 1.6% |
| Seminole | 0.0 /100 | #304 | Tragic 1.6% |
| Blackfeet | 0.0 /100 | #305 | Tragic 1.6% |
| Creek | 0.0 /100 | #306 | Tragic 1.6% |
| Scottish | 0.0 /100 | #307 | Tragic 1.6% |
| Navajo | 0.0 /100 | #308 | Tragic 1.6% |