Immigrants from Panama vs Fijian In Labor Force | Age 20-64
COMPARE
Immigrants from Panama
Fijian
In Labor Force | Age 20-64
In Labor Force | Age 20-64 Comparison
Immigrants from Panama
Fijians
79.1%
IN LABOR FORCE | AGE 20-64
6.9/ 100
METRIC RATING
222nd/ 347
METRIC RANK
78.4%
IN LABOR FORCE | AGE 20-64
0.1/ 100
METRIC RATING
262nd/ 347
METRIC RANK
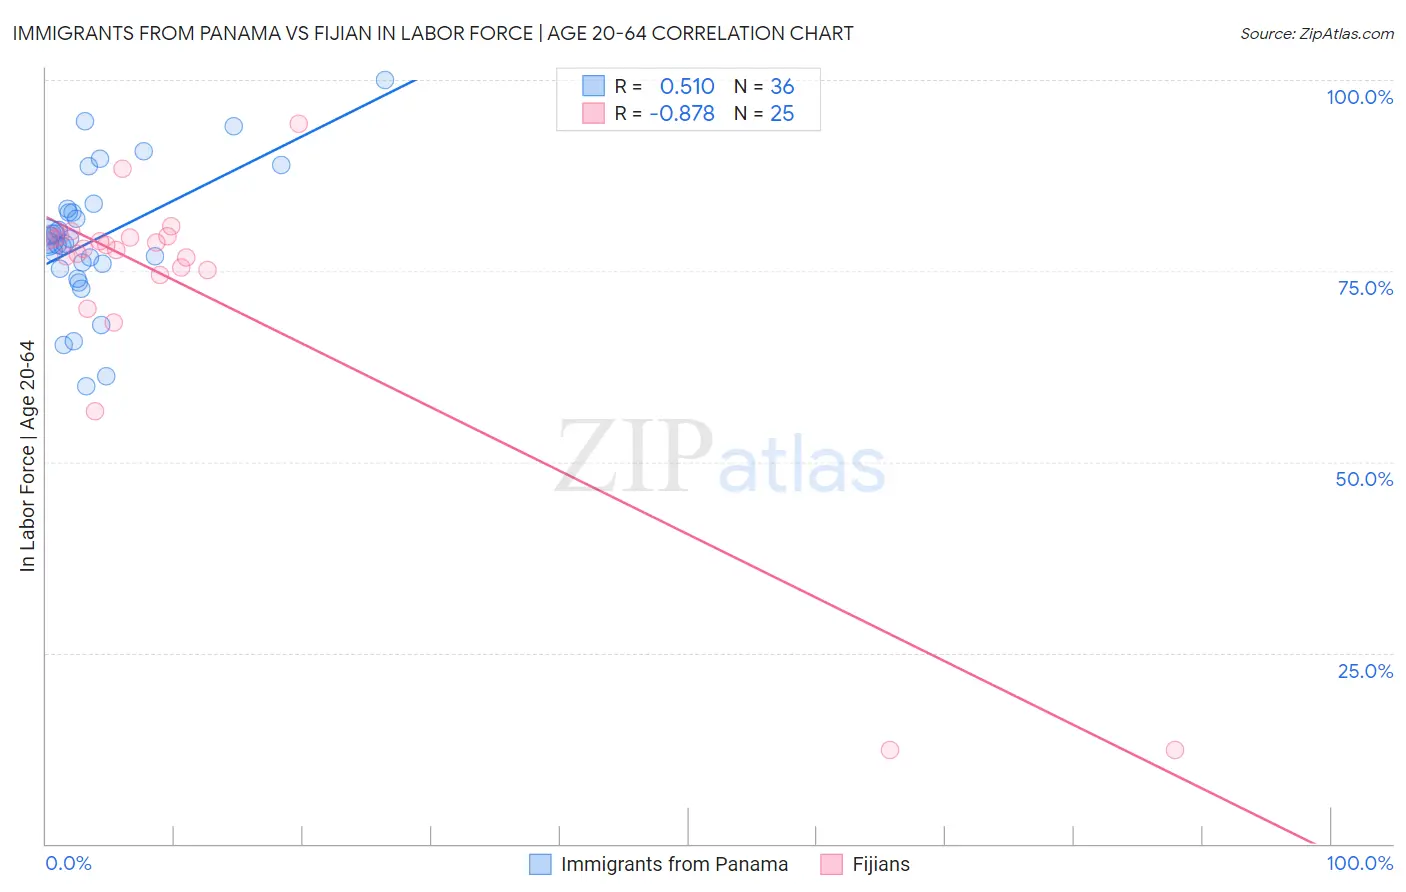
Immigrants from Panama vs Fijian In Labor Force | Age 20-64 Correlation Chart
The statistical analysis conducted on geographies consisting of 221,185,422 people shows a substantial positive correlation between the proportion of Immigrants from Panama and labor force participation rate among population between the ages 20 and 64 in the United States with a correlation coefficient (R) of 0.510 and weighted average of 79.1%. Similarly, the statistical analysis conducted on geographies consisting of 55,948,069 people shows a very strong negative correlation between the proportion of Fijians and labor force participation rate among population between the ages 20 and 64 in the United States with a correlation coefficient (R) of -0.878 and weighted average of 78.4%, a difference of 0.92%.
In Labor Force | Age 20-64 Correlation Summary
| Measurement | Immigrants from Panama | Fijian |
| Minimum | 59.9% | 12.2% |
| Maximum | 100.0% | 94.3% |
| Range | 40.1% | 82.1% |
| Mean | 79.2% | 72.3% |
| Median | 78.9% | 77.9% |
| Interquartile 25% (IQ1) | 75.6% | 74.8% |
| Interquartile 75% (IQ3) | 82.9% | 79.5% |
| Interquartile Range (IQR) | 7.3% | 4.7% |
| Standard Deviation (Sample) | 8.8% | 19.2% |
| Standard Deviation (Population) | 8.7% | 18.9% |
Similar Demographics by In Labor Force | Age 20-64
Demographics Similar to Immigrants from Panama by In Labor Force | Age 20-64
In terms of in labor force | age 20-64, the demographic groups most similar to Immigrants from Panama are Canadian (79.1%, a difference of 0.0%), Immigrants from Uzbekistan (79.1%, a difference of 0.0%), Hungarian (79.2%, a difference of 0.010%), Portuguese (79.1%, a difference of 0.020%), and Immigrants (79.2%, a difference of 0.030%).
| Demographics | Rating | Rank | In Labor Force | Age 20-64 |
| Immigrants | Norway | 12.0 /100 | #215 | Poor 79.2% |
| Arabs | 11.4 /100 | #216 | Poor 79.2% |
| Immigrants | Western Asia | 11.0 /100 | #217 | Poor 79.2% |
| Immigrants | England | 9.3 /100 | #218 | Tragic 79.2% |
| French Canadians | 8.4 /100 | #219 | Tragic 79.2% |
| Immigrants | Immigrants | 7.7 /100 | #220 | Tragic 79.2% |
| Hungarians | 7.2 /100 | #221 | Tragic 79.2% |
| Immigrants | Panama | 6.9 /100 | #222 | Tragic 79.1% |
| Canadians | 6.8 /100 | #223 | Tragic 79.1% |
| Immigrants | Uzbekistan | 6.8 /100 | #224 | Tragic 79.1% |
| Portuguese | 6.4 /100 | #225 | Tragic 79.1% |
| Central Americans | 5.9 /100 | #226 | Tragic 79.1% |
| Immigrants | Western Europe | 5.9 /100 | #227 | Tragic 79.1% |
| Panamanians | 5.7 /100 | #228 | Tragic 79.1% |
| Alsatians | 5.7 /100 | #229 | Tragic 79.1% |
Demographics Similar to Fijians by In Labor Force | Age 20-64
In terms of in labor force | age 20-64, the demographic groups most similar to Fijians are Pennsylvania German (78.4%, a difference of 0.010%), Spaniard (78.4%, a difference of 0.020%), British West Indian (78.4%, a difference of 0.060%), Bahamian (78.4%, a difference of 0.060%), and U.S. Virgin Islander (78.4%, a difference of 0.080%).
| Demographics | Rating | Rank | In Labor Force | Age 20-64 |
| Hawaiians | 0.5 /100 | #255 | Tragic 78.7% |
| Celtics | 0.5 /100 | #256 | Tragic 78.7% |
| Guatemalans | 0.4 /100 | #257 | Tragic 78.7% |
| Immigrants | Guatemala | 0.4 /100 | #258 | Tragic 78.7% |
| Tsimshian | 0.4 /100 | #259 | Tragic 78.7% |
| Immigrants | Fiji | 0.3 /100 | #260 | Tragic 78.6% |
| Whites/Caucasians | 0.2 /100 | #261 | Tragic 78.5% |
| Fijians | 0.1 /100 | #262 | Tragic 78.4% |
| Pennsylvania Germans | 0.1 /100 | #263 | Tragic 78.4% |
| Spaniards | 0.1 /100 | #264 | Tragic 78.4% |
| British West Indians | 0.1 /100 | #265 | Tragic 78.4% |
| Bahamians | 0.1 /100 | #266 | Tragic 78.4% |
| U.S. Virgin Islanders | 0.1 /100 | #267 | Tragic 78.4% |
| West Indians | 0.0 /100 | #268 | Tragic 78.3% |
| Immigrants | Barbados | 0.0 /100 | #269 | Tragic 78.3% |