Immigrants from Barbados vs Bolivian Ambulatory Disability
COMPARE
Immigrants from Barbados
Bolivian
Ambulatory Disability
Ambulatory Disability Comparison
Immigrants from Barbados
Bolivians
6.8%
AMBULATORY DISABILITY
0.0/ 100
METRIC RATING
283rd/ 347
METRIC RANK
5.1%
AMBULATORY DISABILITY
100.0/ 100
METRIC RATING
7th/ 347
METRIC RANK
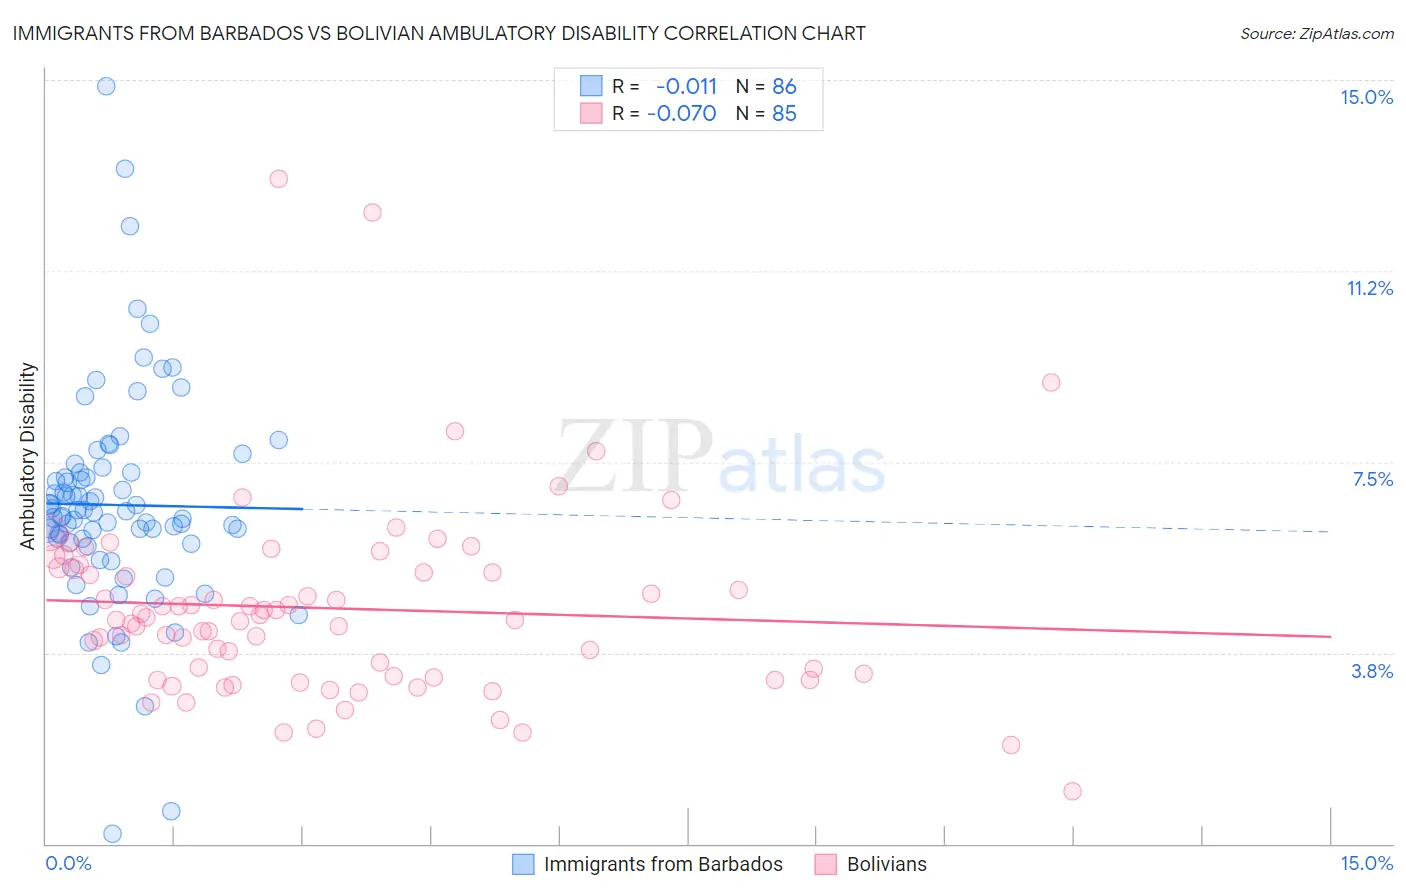
Immigrants from Barbados vs Bolivian Ambulatory Disability Correlation Chart
The statistical analysis conducted on geographies consisting of 112,777,280 people shows no correlation between the proportion of Immigrants from Barbados and percentage of population with ambulatory disability in the United States with a correlation coefficient (R) of -0.011 and weighted average of 6.8%. Similarly, the statistical analysis conducted on geographies consisting of 184,650,218 people shows a slight negative correlation between the proportion of Bolivians and percentage of population with ambulatory disability in the United States with a correlation coefficient (R) of -0.070 and weighted average of 5.1%, a difference of 34.0%.
Ambulatory Disability Correlation Summary
| Measurement | Immigrants from Barbados | Bolivian |
| Minimum | 0.21% | 1.0% |
| Maximum | 14.9% | 13.1% |
| Range | 14.7% | 12.0% |
| Mean | 6.7% | 4.6% |
| Median | 6.5% | 4.4% |
| Interquartile 25% (IQ1) | 5.9% | 3.3% |
| Interquartile 75% (IQ3) | 7.3% | 5.4% |
| Interquartile Range (IQR) | 1.4% | 2.1% |
| Standard Deviation (Sample) | 2.1% | 1.9% |
| Standard Deviation (Population) | 2.1% | 1.9% |
Similar Demographics by Ambulatory Disability
Demographics Similar to Immigrants from Barbados by Ambulatory Disability
In terms of ambulatory disability, the demographic groups most similar to Immigrants from Barbados are Immigrants from Jamaica (6.8%, a difference of 0.070%), Barbadian (6.8%, a difference of 0.16%), Yaqui (6.8%, a difference of 0.28%), Pennsylvania German (6.8%, a difference of 0.36%), and Immigrants from Caribbean (6.7%, a difference of 0.45%).
| Demographics | Rating | Rank | Ambulatory Disability |
| Celtics | 0.1 /100 | #276 | Tragic 6.7% |
| Jamaicans | 0.1 /100 | #277 | Tragic 6.7% |
| Immigrants | West Indies | 0.1 /100 | #278 | Tragic 6.7% |
| Immigrants | Caribbean | 0.0 /100 | #279 | Tragic 6.7% |
| Pennsylvania Germans | 0.0 /100 | #280 | Tragic 6.8% |
| Yaqui | 0.0 /100 | #281 | Tragic 6.8% |
| Barbadians | 0.0 /100 | #282 | Tragic 6.8% |
| Immigrants | Barbados | 0.0 /100 | #283 | Tragic 6.8% |
| Immigrants | Jamaica | 0.0 /100 | #284 | Tragic 6.8% |
| Fijians | 0.0 /100 | #285 | Tragic 6.8% |
| Yakama | 0.0 /100 | #286 | Tragic 6.8% |
| U.S. Virgin Islanders | 0.0 /100 | #287 | Tragic 6.8% |
| Immigrants | Nonimmigrants | 0.0 /100 | #288 | Tragic 6.9% |
| Immigrants | Dominica | 0.0 /100 | #289 | Tragic 6.9% |
| Scotch-Irish | 0.0 /100 | #290 | Tragic 6.9% |
Demographics Similar to Bolivians by Ambulatory Disability
In terms of ambulatory disability, the demographic groups most similar to Bolivians are Immigrants from Bolivia (5.0%, a difference of 0.38%), Immigrants from South Central Asia (5.1%, a difference of 0.99%), Immigrants from Singapore (5.0%, a difference of 1.1%), Iranian (5.1%, a difference of 1.4%), and Yup'ik (5.2%, a difference of 2.0%).
| Demographics | Rating | Rank | Ambulatory Disability |
| Immigrants | India | 100.0 /100 | #1 | Exceptional 4.8% |
| Filipinos | 100.0 /100 | #2 | Exceptional 4.9% |
| Thais | 100.0 /100 | #3 | Exceptional 4.9% |
| Immigrants | Taiwan | 100.0 /100 | #4 | Exceptional 4.9% |
| Immigrants | Singapore | 100.0 /100 | #5 | Exceptional 5.0% |
| Immigrants | Bolivia | 100.0 /100 | #6 | Exceptional 5.0% |
| Bolivians | 100.0 /100 | #7 | Exceptional 5.1% |
| Immigrants | South Central Asia | 100.0 /100 | #8 | Exceptional 5.1% |
| Iranians | 100.0 /100 | #9 | Exceptional 5.1% |
| Yup'ik | 100.0 /100 | #10 | Exceptional 5.2% |
| Immigrants | Korea | 100.0 /100 | #11 | Exceptional 5.2% |
| Okinawans | 100.0 /100 | #12 | Exceptional 5.3% |
| Burmese | 100.0 /100 | #13 | Exceptional 5.3% |
| Immigrants | Eastern Asia | 100.0 /100 | #14 | Exceptional 5.3% |
| Immigrants | China | 100.0 /100 | #15 | Exceptional 5.3% |