Asian vs Bolivian Ambulatory Disability
COMPARE
Asian
Bolivian
Ambulatory Disability
Ambulatory Disability Comparison
Asians
Bolivians
5.4%
AMBULATORY DISABILITY
100.0/ 100
METRIC RATING
27th/ 347
METRIC RANK
5.1%
AMBULATORY DISABILITY
100.0/ 100
METRIC RATING
7th/ 347
METRIC RANK
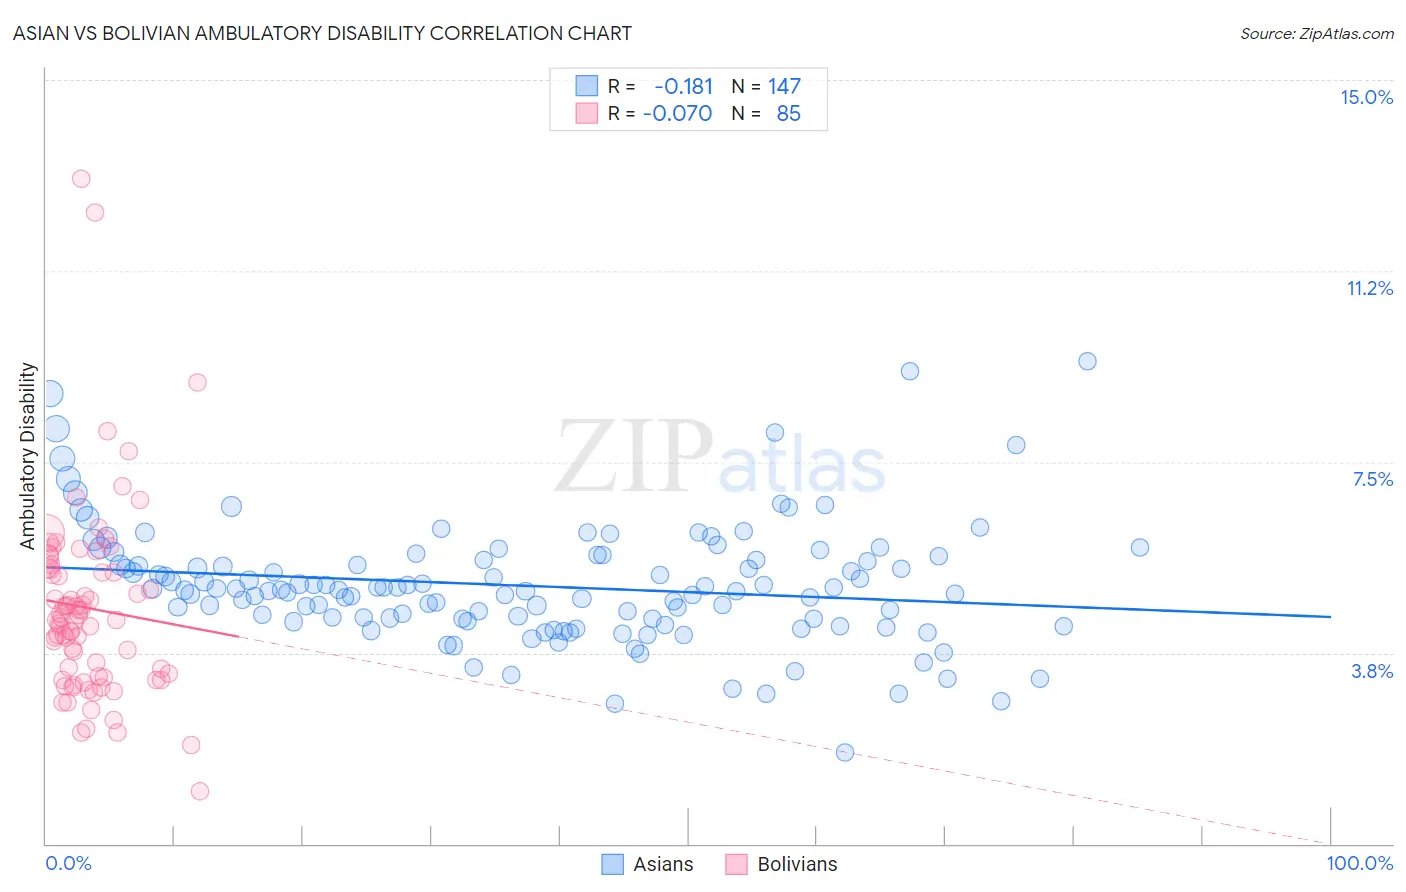
Asian vs Bolivian Ambulatory Disability Correlation Chart
The statistical analysis conducted on geographies consisting of 550,442,799 people shows a poor negative correlation between the proportion of Asians and percentage of population with ambulatory disability in the United States with a correlation coefficient (R) of -0.181 and weighted average of 5.4%. Similarly, the statistical analysis conducted on geographies consisting of 184,650,218 people shows a slight negative correlation between the proportion of Bolivians and percentage of population with ambulatory disability in the United States with a correlation coefficient (R) of -0.070 and weighted average of 5.1%, a difference of 6.9%.
Ambulatory Disability Correlation Summary
| Measurement | Asian | Bolivian |
| Minimum | 1.8% | 1.0% |
| Maximum | 9.5% | 13.1% |
| Range | 7.7% | 12.0% |
| Mean | 5.1% | 4.6% |
| Median | 5.0% | 4.4% |
| Interquartile 25% (IQ1) | 4.4% | 3.3% |
| Interquartile 75% (IQ3) | 5.6% | 5.4% |
| Interquartile Range (IQR) | 1.2% | 2.1% |
| Standard Deviation (Sample) | 1.2% | 1.9% |
| Standard Deviation (Population) | 1.2% | 1.9% |
Demographics Similar to Asians and Bolivians by Ambulatory Disability
In terms of ambulatory disability, the demographic groups most similar to Asians are Immigrants from Nepal (5.4%, a difference of 0.16%), Zimbabwean (5.4%, a difference of 0.19%), Immigrants from Saudi Arabia (5.4%, a difference of 0.27%), Tongan (5.4%, a difference of 0.36%), and Immigrants from Israel (5.4%, a difference of 0.41%). Similarly, the demographic groups most similar to Bolivians are Immigrants from South Central Asia (5.1%, a difference of 0.99%), Iranian (5.1%, a difference of 1.4%), Yup'ik (5.2%, a difference of 2.0%), Immigrants from Korea (5.2%, a difference of 3.6%), and Okinawan (5.3%, a difference of 4.0%).
| Demographics | Rating | Rank | Ambulatory Disability |
| Bolivians | 100.0 /100 | #7 | Exceptional 5.1% |
| Immigrants | South Central Asia | 100.0 /100 | #8 | Exceptional 5.1% |
| Iranians | 100.0 /100 | #9 | Exceptional 5.1% |
| Yup'ik | 100.0 /100 | #10 | Exceptional 5.2% |
| Immigrants | Korea | 100.0 /100 | #11 | Exceptional 5.2% |
| Okinawans | 100.0 /100 | #12 | Exceptional 5.3% |
| Burmese | 100.0 /100 | #13 | Exceptional 5.3% |
| Immigrants | Eastern Asia | 100.0 /100 | #14 | Exceptional 5.3% |
| Immigrants | China | 100.0 /100 | #15 | Exceptional 5.3% |
| Immigrants | Hong Kong | 100.0 /100 | #16 | Exceptional 5.3% |
| Immigrants | Ethiopia | 100.0 /100 | #17 | Exceptional 5.4% |
| Immigrants | Sri Lanka | 100.0 /100 | #18 | Exceptional 5.4% |
| Indians (Asian) | 100.0 /100 | #19 | Exceptional 5.4% |
| Ethiopians | 100.0 /100 | #20 | Exceptional 5.4% |
| Immigrants | Kuwait | 100.0 /100 | #21 | Exceptional 5.4% |
| Immigrants | Israel | 100.0 /100 | #22 | Exceptional 5.4% |
| Tongans | 100.0 /100 | #23 | Exceptional 5.4% |
| Immigrants | Saudi Arabia | 100.0 /100 | #24 | Exceptional 5.4% |
| Zimbabweans | 100.0 /100 | #25 | Exceptional 5.4% |
| Immigrants | Nepal | 100.0 /100 | #26 | Exceptional 5.4% |
| Asians | 100.0 /100 | #27 | Exceptional 5.4% |