Spanish vs Arapaho Vision Disability
COMPARE
Spanish
Arapaho
Vision Disability
Vision Disability Comparison
Spanish
Arapaho
2.4%
VISION DISABILITY
0.0/ 100
METRIC RATING
278th/ 347
METRIC RANK
2.6%
VISION DISABILITY
0.0/ 100
METRIC RATING
308th/ 347
METRIC RANK
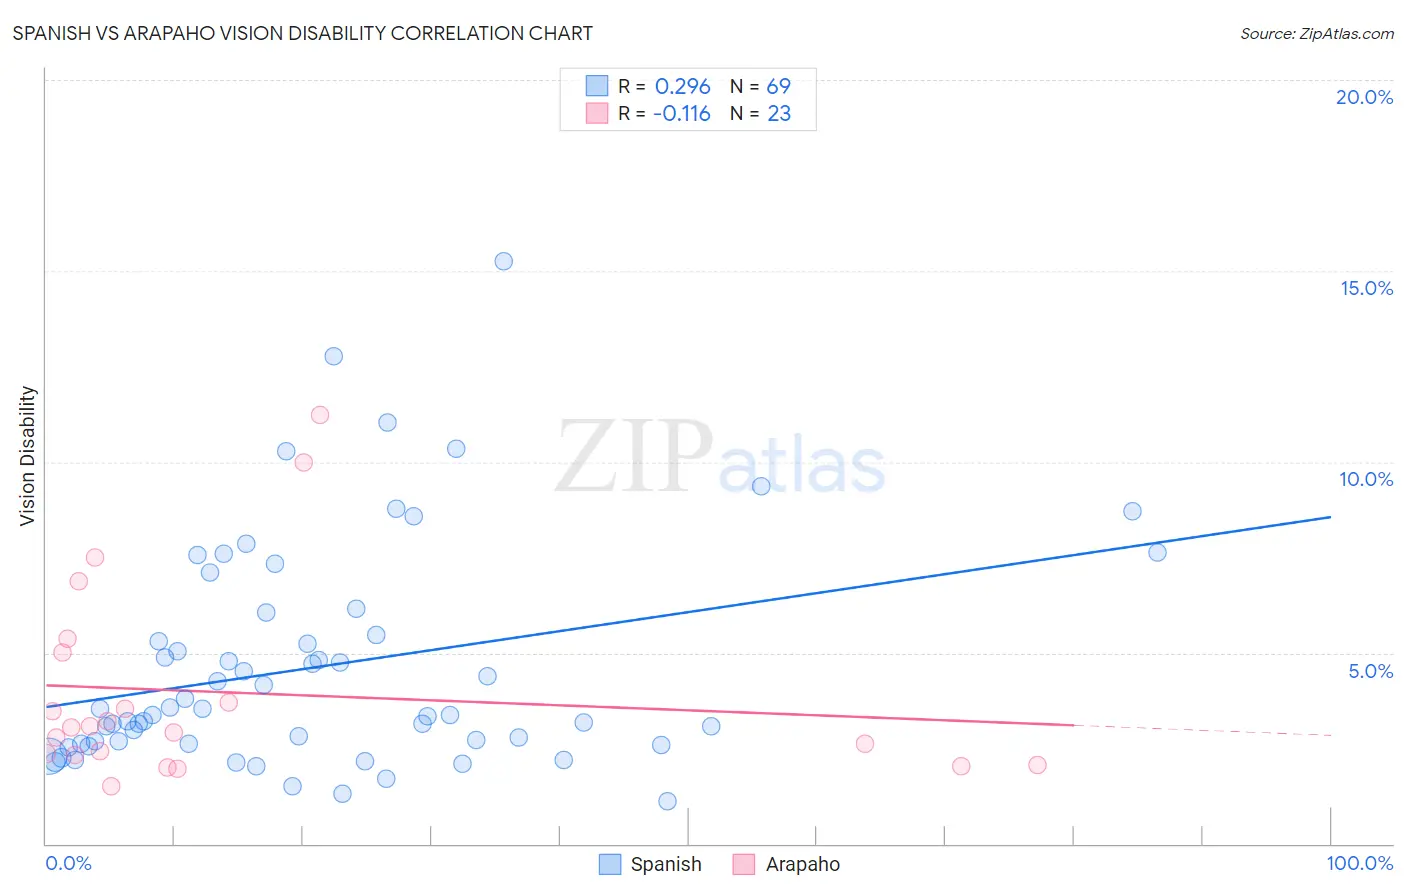
Spanish vs Arapaho Vision Disability Correlation Chart
The statistical analysis conducted on geographies consisting of 421,761,942 people shows a weak positive correlation between the proportion of Spanish and percentage of population with vision disability in the United States with a correlation coefficient (R) of 0.296 and weighted average of 2.4%. Similarly, the statistical analysis conducted on geographies consisting of 29,770,133 people shows a poor negative correlation between the proportion of Arapaho and percentage of population with vision disability in the United States with a correlation coefficient (R) of -0.116 and weighted average of 2.6%, a difference of 6.7%.
Vision Disability Correlation Summary
| Measurement | Spanish | Arapaho |
| Minimum | 1.1% | 1.5% |
| Maximum | 15.3% | 11.2% |
| Range | 14.1% | 9.7% |
| Mean | 4.6% | 4.0% |
| Median | 3.4% | 3.1% |
| Interquartile 25% (IQ1) | 2.6% | 2.3% |
| Interquartile 75% (IQ3) | 5.8% | 5.0% |
| Interquartile Range (IQR) | 3.1% | 2.7% |
| Standard Deviation (Sample) | 2.9% | 2.6% |
| Standard Deviation (Population) | 2.9% | 2.5% |
Similar Demographics by Vision Disability
Demographics Similar to Spanish by Vision Disability
In terms of vision disability, the demographic groups most similar to Spanish are Nepalese (2.4%, a difference of 0.010%), Cape Verdean (2.4%, a difference of 0.050%), Bahamian (2.4%, a difference of 0.16%), Scotch-Irish (2.4%, a difference of 0.20%), and U.S. Virgin Islander (2.5%, a difference of 0.28%).
| Demographics | Rating | Rank | Vision Disability |
| Immigrants | Azores | 0.1 /100 | #271 | Tragic 2.4% |
| Spaniards | 0.1 /100 | #272 | Tragic 2.4% |
| Immigrants | Bahamas | 0.1 /100 | #273 | Tragic 2.4% |
| Immigrants | Latin America | 0.0 /100 | #274 | Tragic 2.4% |
| Chippewa | 0.0 /100 | #275 | Tragic 2.4% |
| Scotch-Irish | 0.0 /100 | #276 | Tragic 2.4% |
| Bahamians | 0.0 /100 | #277 | Tragic 2.4% |
| Spanish | 0.0 /100 | #278 | Tragic 2.4% |
| Nepalese | 0.0 /100 | #279 | Tragic 2.4% |
| Cape Verdeans | 0.0 /100 | #280 | Tragic 2.4% |
| U.S. Virgin Islanders | 0.0 /100 | #281 | Tragic 2.5% |
| Immigrants | Caribbean | 0.0 /100 | #282 | Tragic 2.5% |
| Puget Sound Salish | 0.0 /100 | #283 | Tragic 2.5% |
| Yakama | 0.0 /100 | #284 | Tragic 2.5% |
| Immigrants | Central America | 0.0 /100 | #285 | Tragic 2.5% |
Demographics Similar to Arapaho by Vision Disability
In terms of vision disability, the demographic groups most similar to Arapaho are Immigrants from Dominican Republic (2.6%, a difference of 0.020%), Iroquois (2.6%, a difference of 0.040%), Immigrants from Yemen (2.6%, a difference of 0.29%), Blackfeet (2.6%, a difference of 0.61%), and Hispanic or Latino (2.6%, a difference of 0.65%).
| Demographics | Rating | Rank | Vision Disability |
| Menominee | 0.0 /100 | #301 | Tragic 2.5% |
| Spanish American Indians | 0.0 /100 | #302 | Tragic 2.6% |
| Immigrants | Cabo Verde | 0.0 /100 | #303 | Tragic 2.6% |
| Aleuts | 0.0 /100 | #304 | Tragic 2.6% |
| Hispanics or Latinos | 0.0 /100 | #305 | Tragic 2.6% |
| Iroquois | 0.0 /100 | #306 | Tragic 2.6% |
| Immigrants | Dominican Republic | 0.0 /100 | #307 | Tragic 2.6% |
| Arapaho | 0.0 /100 | #308 | Tragic 2.6% |
| Immigrants | Yemen | 0.0 /100 | #309 | Tragic 2.6% |
| Blackfeet | 0.0 /100 | #310 | Tragic 2.6% |
| Dominicans | 0.0 /100 | #311 | Tragic 2.6% |
| Americans | 0.0 /100 | #312 | Tragic 2.6% |
| Potawatomi | 0.0 /100 | #313 | Tragic 2.6% |
| Inupiat | 0.0 /100 | #314 | Tragic 2.7% |
| Osage | 0.0 /100 | #315 | Tragic 2.7% |