Immigrants from Norway vs Ugandan 5th Grade
COMPARE
Immigrants from Norway
Ugandan
5th Grade
5th Grade Comparison
Immigrants from Norway
Ugandans
97.6%
5TH GRADE
94.6/ 100
METRIC RATING
123rd/ 347
METRIC RANK
97.4%
5TH GRADE
58.9/ 100
METRIC RATING
163rd/ 347
METRIC RANK
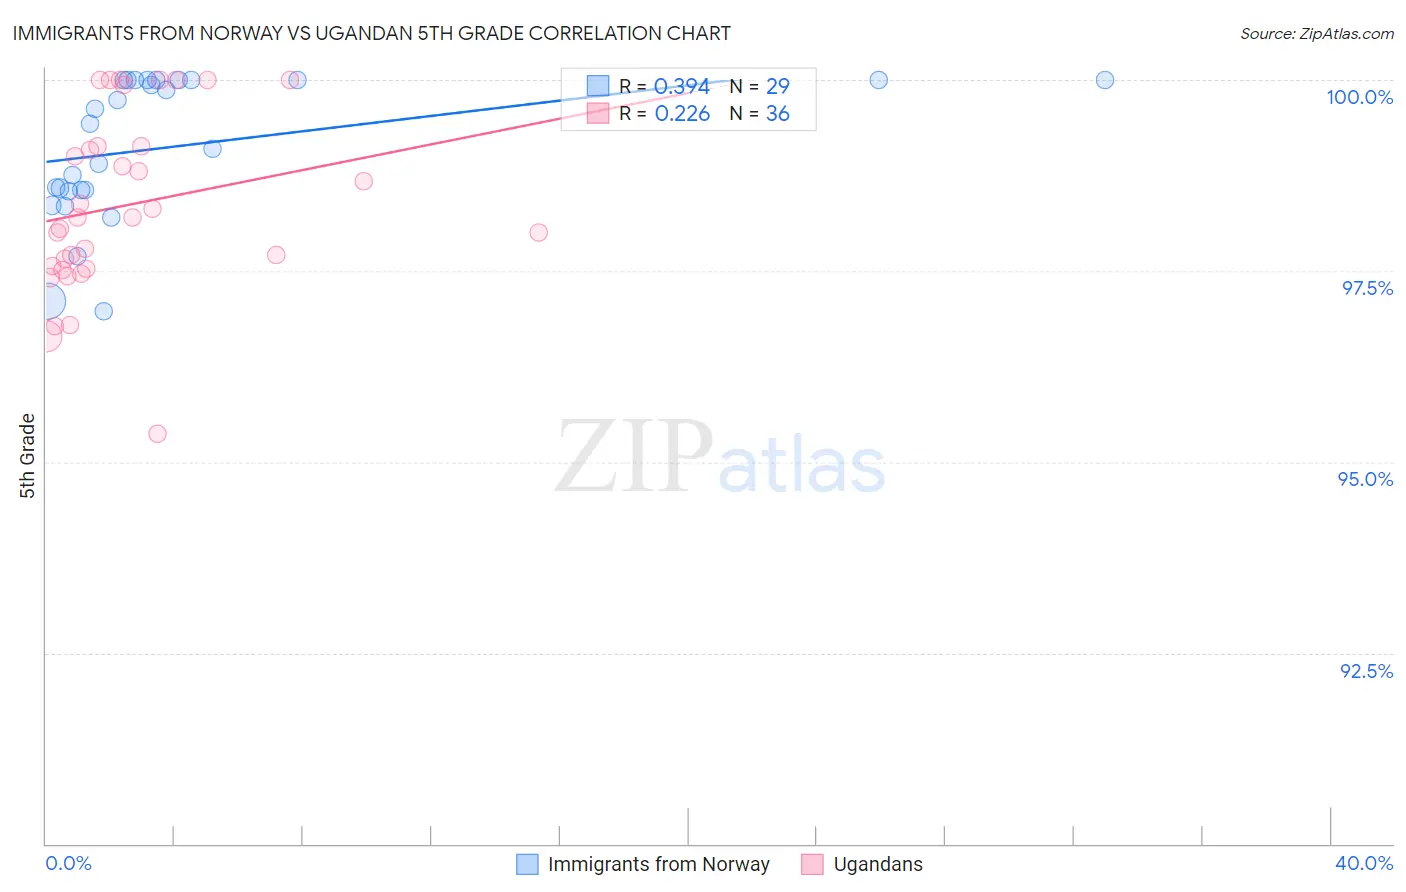
Immigrants from Norway vs Ugandan 5th Grade Correlation Chart
The statistical analysis conducted on geographies consisting of 116,716,420 people shows a mild positive correlation between the proportion of Immigrants from Norway and percentage of population with at least 5th grade education in the United States with a correlation coefficient (R) of 0.394 and weighted average of 97.6%. Similarly, the statistical analysis conducted on geographies consisting of 93,991,892 people shows a weak positive correlation between the proportion of Ugandans and percentage of population with at least 5th grade education in the United States with a correlation coefficient (R) of 0.226 and weighted average of 97.4%, a difference of 0.26%.
5th Grade Correlation Summary
| Measurement | Immigrants from Norway | Ugandan |
| Minimum | 97.0% | 95.4% |
| Maximum | 100.0% | 100.0% |
| Range | 3.0% | 4.6% |
| Mean | 99.1% | 98.4% |
| Median | 99.4% | 98.2% |
| Interquartile 25% (IQ1) | 98.5% | 97.5% |
| Interquartile 75% (IQ3) | 100.0% | 99.1% |
| Interquartile Range (IQR) | 1.5% | 1.6% |
| Standard Deviation (Sample) | 0.93% | 1.2% |
| Standard Deviation (Population) | 0.91% | 1.1% |
Similar Demographics by 5th Grade
Demographics Similar to Immigrants from Norway by 5th Grade
In terms of 5th grade, the demographic groups most similar to Immigrants from Norway are Immigrants from France (97.6%, a difference of 0.0%), Immigrants from Japan (97.6%, a difference of 0.0%), Basque (97.6%, a difference of 0.010%), Syrian (97.6%, a difference of 0.010%), and Immigrants from Zimbabwe (97.6%, a difference of 0.010%).
| Demographics | Rating | Rank | 5th Grade |
| Immigrants | Croatia | 95.5 /100 | #116 | Exceptional 97.6% |
| Immigrants | Saudi Arabia | 95.4 /100 | #117 | Exceptional 97.6% |
| Basques | 95.2 /100 | #118 | Exceptional 97.6% |
| Syrians | 95.1 /100 | #119 | Exceptional 97.6% |
| Immigrants | Zimbabwe | 94.9 /100 | #120 | Exceptional 97.6% |
| Immigrants | France | 94.8 /100 | #121 | Exceptional 97.6% |
| Immigrants | Japan | 94.7 /100 | #122 | Exceptional 97.6% |
| Immigrants | Norway | 94.6 /100 | #123 | Exceptional 97.6% |
| Spanish | 93.7 /100 | #124 | Exceptional 97.6% |
| Immigrants | Bulgaria | 93.1 /100 | #125 | Exceptional 97.6% |
| Hmong | 92.3 /100 | #126 | Exceptional 97.6% |
| Immigrants | Serbia | 92.3 /100 | #127 | Exceptional 97.6% |
| Colville | 92.0 /100 | #128 | Exceptional 97.6% |
| Immigrants | Europe | 91.9 /100 | #129 | Exceptional 97.6% |
| Immigrants | Romania | 91.6 /100 | #130 | Exceptional 97.6% |
Demographics Similar to Ugandans by 5th Grade
In terms of 5th grade, the demographic groups most similar to Ugandans are Kenyan (97.4%, a difference of 0.0%), Immigrants from Iran (97.4%, a difference of 0.0%), Bermudan (97.4%, a difference of 0.0%), Immigrants from Poland (97.4%, a difference of 0.0%), and Marshallese (97.4%, a difference of 0.010%).
| Demographics | Rating | Rank | 5th Grade |
| French American Indians | 70.5 /100 | #156 | Good 97.4% |
| Immigrants | Jordan | 70.4 /100 | #157 | Good 97.4% |
| Albanians | 68.3 /100 | #158 | Good 97.4% |
| Immigrants | Italy | 65.2 /100 | #159 | Good 97.4% |
| Marshallese | 61.2 /100 | #160 | Good 97.4% |
| Kenyans | 59.7 /100 | #161 | Average 97.4% |
| Immigrants | Iran | 59.5 /100 | #162 | Average 97.4% |
| Ugandans | 58.9 /100 | #163 | Average 97.4% |
| Bermudans | 58.8 /100 | #164 | Average 97.4% |
| Immigrants | Poland | 57.9 /100 | #165 | Average 97.4% |
| Apache | 57.2 /100 | #166 | Average 97.4% |
| Immigrants | Belarus | 54.6 /100 | #167 | Average 97.3% |
| Chileans | 54.5 /100 | #168 | Average 97.3% |
| Immigrants | Korea | 54.1 /100 | #169 | Average 97.3% |
| Venezuelans | 54.0 /100 | #170 | Average 97.3% |