Immigrants from El Salvador vs Ugandan Disability Age Under 5
COMPARE
Immigrants from El Salvador
Ugandan
Disability Age Under 5
Disability Age Under 5 Comparison
Immigrants from El Salvador
Ugandans
1.1%
DISABILITY AGE UNDER 5
99.6/ 100
METRIC RATING
54th/ 347
METRIC RANK
1.1%
DISABILITY AGE UNDER 5
97.5/ 100
METRIC RATING
87th/ 347
METRIC RANK
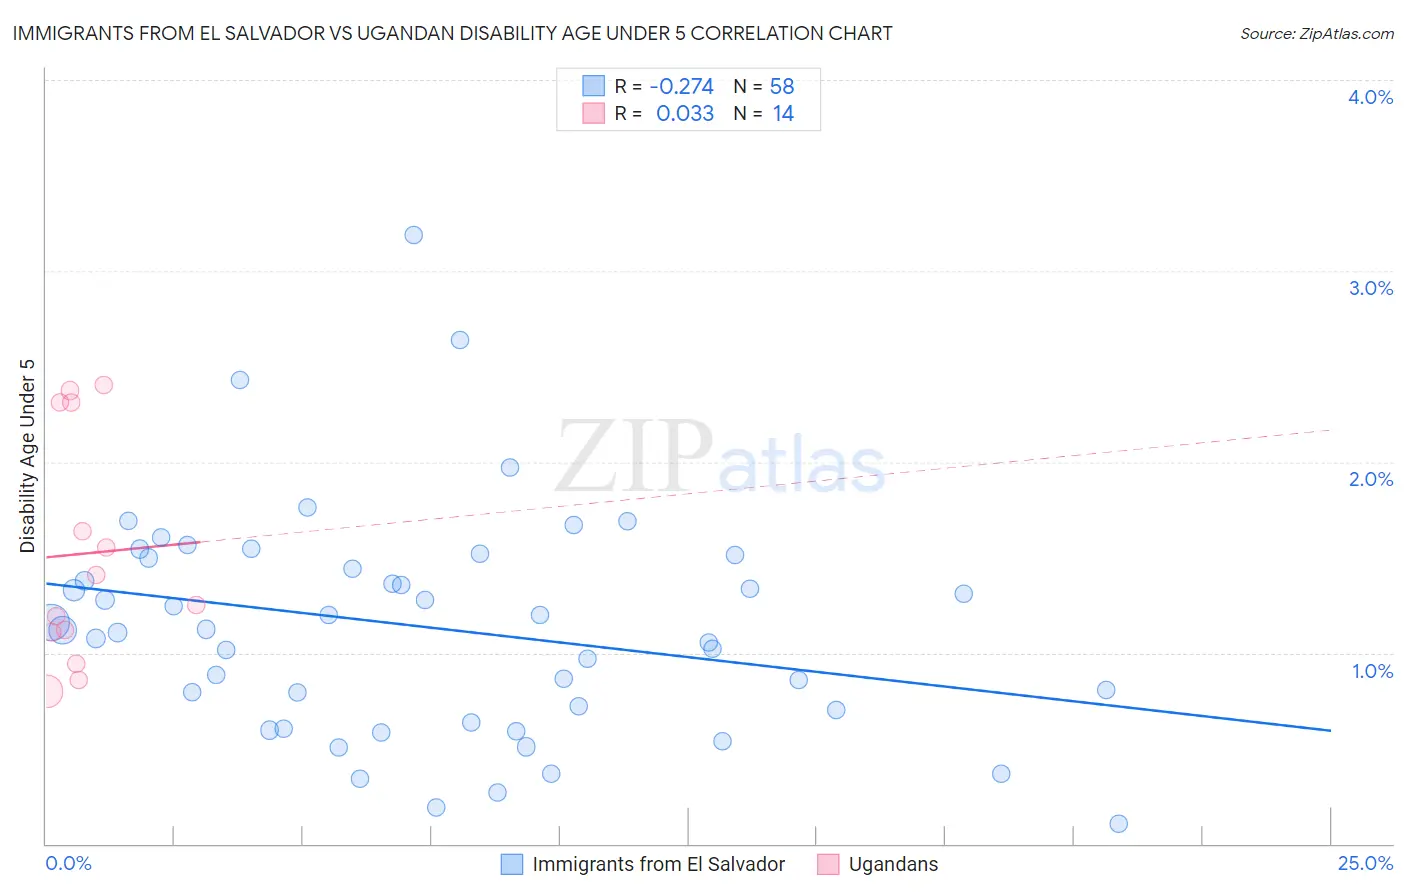
Immigrants from El Salvador vs Ugandan Disability Age Under 5 Correlation Chart
The statistical analysis conducted on geographies consisting of 204,380,401 people shows a weak negative correlation between the proportion of Immigrants from El Salvador and percentage of population with a disability under the age of 5 in the United States with a correlation coefficient (R) of -0.274 and weighted average of 1.1%. Similarly, the statistical analysis conducted on geographies consisting of 75,065,074 people shows no correlation between the proportion of Ugandans and percentage of population with a disability under the age of 5 in the United States with a correlation coefficient (R) of 0.033 and weighted average of 1.1%, a difference of 4.5%.
Disability Age Under 5 Correlation Summary
| Measurement | Immigrants from El Salvador | Ugandan |
| Minimum | 0.10% | 0.80% |
| Maximum | 3.2% | 2.4% |
| Range | 3.1% | 1.6% |
| Mean | 1.1% | 1.5% |
| Median | 1.1% | 1.3% |
| Interquartile 25% (IQ1) | 0.70% | 1.1% |
| Interquartile 75% (IQ3) | 1.5% | 2.3% |
| Interquartile Range (IQR) | 0.80% | 1.2% |
| Standard Deviation (Sample) | 0.59% | 0.59% |
| Standard Deviation (Population) | 0.58% | 0.57% |
Similar Demographics by Disability Age Under 5
Demographics Similar to Immigrants from El Salvador by Disability Age Under 5
In terms of disability age under 5, the demographic groups most similar to Immigrants from El Salvador are Salvadoran (1.1%, a difference of 0.090%), Asian (1.1%, a difference of 0.29%), Ecuadorian (1.1%, a difference of 0.49%), Assyrian/Chaldean/Syriac (1.1%, a difference of 0.52%), and Immigrants from Bolivia (1.1%, a difference of 0.60%).
| Demographics | Rating | Rank | Disability Age Under 5 |
| Immigrants | Sweden | 99.8 /100 | #47 | Exceptional 1.1% |
| Immigrants | Singapore | 99.7 /100 | #48 | Exceptional 1.1% |
| Immigrants | Russia | 99.7 /100 | #49 | Exceptional 1.1% |
| Immigrants | Japan | 99.7 /100 | #50 | Exceptional 1.1% |
| Immigrants | Kazakhstan | 99.7 /100 | #51 | Exceptional 1.1% |
| Immigrants | Bolivia | 99.6 /100 | #52 | Exceptional 1.1% |
| Asians | 99.6 /100 | #53 | Exceptional 1.1% |
| Immigrants | El Salvador | 99.6 /100 | #54 | Exceptional 1.1% |
| Salvadorans | 99.5 /100 | #55 | Exceptional 1.1% |
| Ecuadorians | 99.5 /100 | #56 | Exceptional 1.1% |
| Assyrians/Chaldeans/Syriacs | 99.5 /100 | #57 | Exceptional 1.1% |
| Immigrants | Egypt | 99.4 /100 | #58 | Exceptional 1.1% |
| Immigrants | Malaysia | 99.4 /100 | #59 | Exceptional 1.1% |
| Immigrants | Western Asia | 99.2 /100 | #60 | Exceptional 1.1% |
| Immigrants | Ethiopia | 99.2 /100 | #61 | Exceptional 1.1% |
Demographics Similar to Ugandans by Disability Age Under 5
In terms of disability age under 5, the demographic groups most similar to Ugandans are Okinawan (1.1%, a difference of 0.020%), Immigrants from Dominican Republic (1.1%, a difference of 0.020%), Sudanese (1.1%, a difference of 0.14%), Immigrants from Zaire (1.1%, a difference of 0.22%), and Ethiopian (1.1%, a difference of 0.31%).
| Demographics | Rating | Rank | Disability Age Under 5 |
| Immigrants | Trinidad and Tobago | 98.0 /100 | #80 | Exceptional 1.1% |
| Turks | 98.0 /100 | #81 | Exceptional 1.1% |
| Immigrants | Jordan | 97.9 /100 | #82 | Exceptional 1.1% |
| Immigrants | Syria | 97.9 /100 | #83 | Exceptional 1.1% |
| Immigrants | Zaire | 97.8 /100 | #84 | Exceptional 1.1% |
| Sudanese | 97.7 /100 | #85 | Exceptional 1.1% |
| Okinawans | 97.6 /100 | #86 | Exceptional 1.1% |
| Ugandans | 97.5 /100 | #87 | Exceptional 1.1% |
| Immigrants | Dominican Republic | 97.5 /100 | #88 | Exceptional 1.1% |
| Ethiopians | 97.2 /100 | #89 | Exceptional 1.1% |
| Chinese | 97.2 /100 | #90 | Exceptional 1.1% |
| Albanians | 97.2 /100 | #91 | Exceptional 1.1% |
| Immigrants | Cuba | 97.0 /100 | #92 | Exceptional 1.1% |
| Spanish Americans | 96.9 /100 | #93 | Exceptional 1.1% |
| Sri Lankans | 96.8 /100 | #94 | Exceptional 1.1% |