Immigrants from Norway vs Filipino Hearing Disability
COMPARE
Immigrants from Norway
Filipino
Hearing Disability
Hearing Disability Comparison
Immigrants from Norway
Filipinos
3.2%
HEARING DISABILITY
7.3/ 100
METRIC RATING
216th/ 347
METRIC RANK
2.6%
HEARING DISABILITY
99.6/ 100
METRIC RATING
33rd/ 347
METRIC RANK
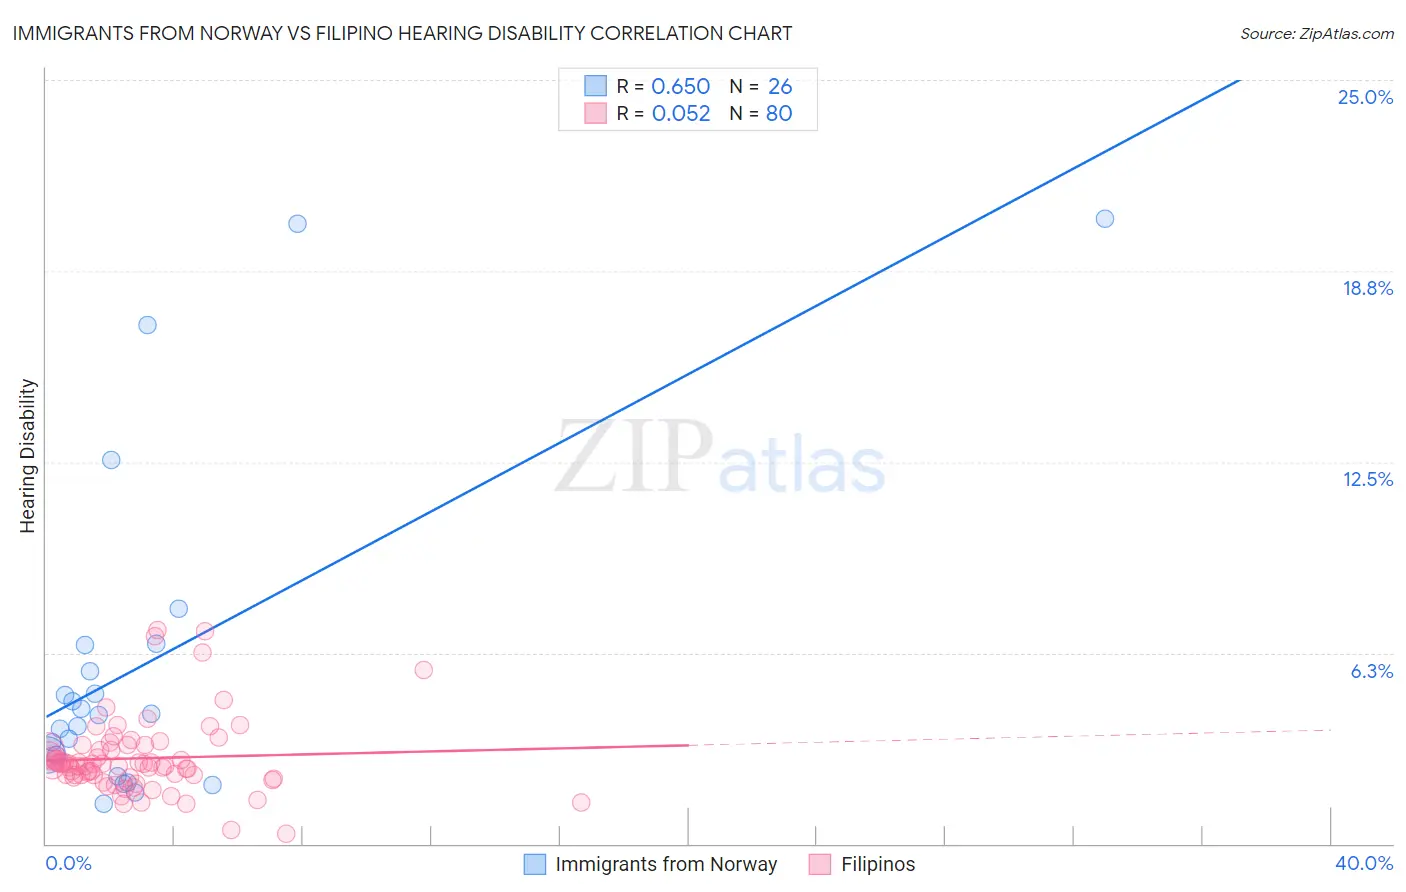
Immigrants from Norway vs Filipino Hearing Disability Correlation Chart
The statistical analysis conducted on geographies consisting of 116,704,469 people shows a significant positive correlation between the proportion of Immigrants from Norway and percentage of population with hearing disability in the United States with a correlation coefficient (R) of 0.650 and weighted average of 3.2%. Similarly, the statistical analysis conducted on geographies consisting of 254,308,398 people shows a slight positive correlation between the proportion of Filipinos and percentage of population with hearing disability in the United States with a correlation coefficient (R) of 0.052 and weighted average of 2.6%, a difference of 21.8%.
Hearing Disability Correlation Summary
| Measurement | Immigrants from Norway | Filipino |
| Minimum | 1.3% | 0.31% |
| Maximum | 20.5% | 7.0% |
| Range | 19.1% | 6.7% |
| Mean | 6.0% | 2.8% |
| Median | 4.2% | 2.6% |
| Interquartile 25% (IQ1) | 2.9% | 2.2% |
| Interquartile 75% (IQ3) | 6.5% | 3.2% |
| Interquartile Range (IQR) | 3.6% | 0.96% |
| Standard Deviation (Sample) | 5.4% | 1.3% |
| Standard Deviation (Population) | 5.3% | 1.2% |
Similar Demographics by Hearing Disability
Demographics Similar to Immigrants from Norway by Hearing Disability
In terms of hearing disability, the demographic groups most similar to Immigrants from Norway are Russian (3.2%, a difference of 0.080%), Immigrants from Northern Europe (3.2%, a difference of 0.12%), New Zealander (3.2%, a difference of 0.17%), Bangladeshi (3.2%, a difference of 0.24%), and Malaysian (3.2%, a difference of 0.24%).
| Demographics | Rating | Rank | Hearing Disability |
| Immigrants | Hungary | 12.5 /100 | #209 | Poor 3.1% |
| Cape Verdeans | 12.2 /100 | #210 | Poor 3.1% |
| Romanians | 12.1 /100 | #211 | Poor 3.1% |
| Pakistanis | 11.1 /100 | #212 | Poor 3.1% |
| Immigrants | Iraq | 10.5 /100 | #213 | Poor 3.1% |
| Australians | 8.1 /100 | #214 | Tragic 3.2% |
| Bangladeshis | 8.1 /100 | #215 | Tragic 3.2% |
| Immigrants | Norway | 7.3 /100 | #216 | Tragic 3.2% |
| Russians | 7.1 /100 | #217 | Tragic 3.2% |
| Immigrants | Northern Europe | 7.0 /100 | #218 | Tragic 3.2% |
| New Zealanders | 6.8 /100 | #219 | Tragic 3.2% |
| Malaysians | 6.6 /100 | #220 | Tragic 3.2% |
| Immigrants | Laos | 6.6 /100 | #221 | Tragic 3.2% |
| Immigrants | Oceania | 6.5 /100 | #222 | Tragic 3.2% |
| Mexicans | 5.6 /100 | #223 | Tragic 3.2% |
Demographics Similar to Filipinos by Hearing Disability
In terms of hearing disability, the demographic groups most similar to Filipinos are Immigrants from Pakistan (2.6%, a difference of 0.040%), Salvadoran (2.6%, a difference of 0.16%), Immigrants from Venezuela (2.6%, a difference of 0.26%), Okinawan (2.6%, a difference of 0.39%), and Immigrants from Cameroon (2.6%, a difference of 0.40%).
| Demographics | Rating | Rank | Hearing Disability |
| Immigrants | Senegal | 99.7 /100 | #26 | Exceptional 2.6% |
| Immigrants | South Central Asia | 99.7 /100 | #27 | Exceptional 2.6% |
| Immigrants | Haiti | 99.7 /100 | #28 | Exceptional 2.6% |
| Bolivians | 99.7 /100 | #29 | Exceptional 2.6% |
| Immigrants | Caribbean | 99.7 /100 | #30 | Exceptional 2.6% |
| Immigrants | Cameroon | 99.7 /100 | #31 | Exceptional 2.6% |
| Immigrants | Venezuela | 99.7 /100 | #32 | Exceptional 2.6% |
| Filipinos | 99.6 /100 | #33 | Exceptional 2.6% |
| Immigrants | Pakistan | 99.6 /100 | #34 | Exceptional 2.6% |
| Salvadorans | 99.6 /100 | #35 | Exceptional 2.6% |
| Okinawans | 99.6 /100 | #36 | Exceptional 2.6% |
| Immigrants | Western Africa | 99.6 /100 | #37 | Exceptional 2.6% |
| Immigrants | Jamaica | 99.5 /100 | #38 | Exceptional 2.6% |
| Immigrants | China | 99.5 /100 | #39 | Exceptional 2.6% |
| Haitians | 99.5 /100 | #40 | Exceptional 2.6% |