Immigrants from Greece vs Cajun Disability
COMPARE
Immigrants from Greece
Cajun
Disability
Disability Comparison
Immigrants from Greece
Cajuns
11.3%
DISABILITY
96.9/ 100
METRIC RATING
100th/ 347
METRIC RANK
14.6%
DISABILITY
0.0/ 100
METRIC RATING
333rd/ 347
METRIC RANK
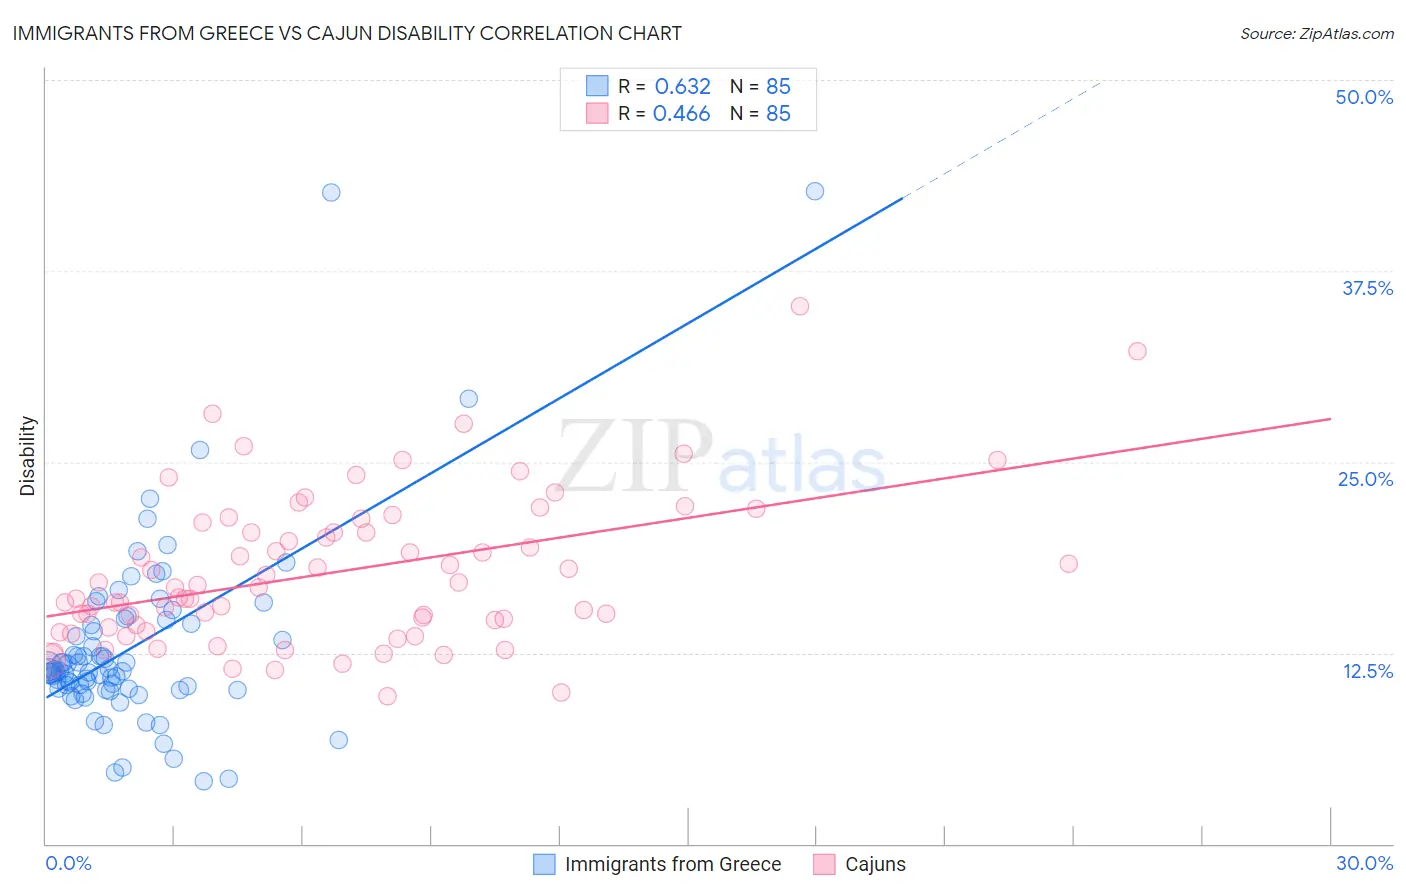
Immigrants from Greece vs Cajun Disability Correlation Chart
The statistical analysis conducted on geographies consisting of 216,878,126 people shows a significant positive correlation between the proportion of Immigrants from Greece and percentage of population with a disability in the United States with a correlation coefficient (R) of 0.632 and weighted average of 11.3%. Similarly, the statistical analysis conducted on geographies consisting of 149,702,868 people shows a moderate positive correlation between the proportion of Cajuns and percentage of population with a disability in the United States with a correlation coefficient (R) of 0.466 and weighted average of 14.6%, a difference of 29.7%.
Disability Correlation Summary
| Measurement | Immigrants from Greece | Cajun |
| Minimum | 4.1% | 9.6% |
| Maximum | 42.7% | 35.2% |
| Range | 38.7% | 25.5% |
| Mean | 12.9% | 17.8% |
| Median | 11.3% | 16.7% |
| Interquartile 25% (IQ1) | 10.1% | 14.3% |
| Interquartile 75% (IQ3) | 14.5% | 20.7% |
| Interquartile Range (IQR) | 4.4% | 6.5% |
| Standard Deviation (Sample) | 6.3% | 4.9% |
| Standard Deviation (Population) | 6.3% | 4.9% |
Similar Demographics by Disability
Demographics Similar to Immigrants from Greece by Disability
In terms of disability, the demographic groups most similar to Immigrants from Greece are Immigrants from Nicaragua (11.3%, a difference of 0.040%), Immigrants from Eastern Africa (11.3%, a difference of 0.11%), Bhutanese (11.2%, a difference of 0.18%), Uruguayan (11.2%, a difference of 0.18%), and Immigrants from Czechoslovakia (11.2%, a difference of 0.18%).
| Demographics | Rating | Rank | Disability |
| Immigrants | Ecuador | 98.0 /100 | #93 | Exceptional 11.2% |
| Immigrants | Morocco | 97.8 /100 | #94 | Exceptional 11.2% |
| Eastern Europeans | 97.8 /100 | #95 | Exceptional 11.2% |
| Immigrants | Zimbabwe | 97.7 /100 | #96 | Exceptional 11.2% |
| Bhutanese | 97.4 /100 | #97 | Exceptional 11.2% |
| Uruguayans | 97.4 /100 | #98 | Exceptional 11.2% |
| Immigrants | Czechoslovakia | 97.4 /100 | #99 | Exceptional 11.2% |
| Immigrants | Greece | 96.9 /100 | #100 | Exceptional 11.3% |
| Immigrants | Nicaragua | 96.8 /100 | #101 | Exceptional 11.3% |
| Immigrants | Eastern Africa | 96.7 /100 | #102 | Exceptional 11.3% |
| Immigrants | Uruguay | 96.4 /100 | #103 | Exceptional 11.3% |
| Immigrants | Immigrants | 96.4 /100 | #104 | Exceptional 11.3% |
| Immigrants | Kazakhstan | 96.4 /100 | #105 | Exceptional 11.3% |
| Immigrants | Eastern Europe | 96.3 /100 | #106 | Exceptional 11.3% |
| Nicaraguans | 96.2 /100 | #107 | Exceptional 11.3% |
Demographics Similar to Cajuns by Disability
In terms of disability, the demographic groups most similar to Cajuns are Yuman (14.6%, a difference of 0.12%), Pueblo (14.4%, a difference of 1.1%), Alaskan Athabascan (14.4%, a difference of 1.1%), Tohono O'odham (14.8%, a difference of 1.2%), and Cherokee (14.8%, a difference of 1.7%).
| Demographics | Rating | Rank | Disability |
| Osage | 0.0 /100 | #326 | Tragic 14.2% |
| Ottawa | 0.0 /100 | #327 | Tragic 14.2% |
| Immigrants | Azores | 0.0 /100 | #328 | Tragic 14.2% |
| Potawatomi | 0.0 /100 | #329 | Tragic 14.2% |
| Navajo | 0.0 /100 | #330 | Tragic 14.3% |
| Alaskan Athabascans | 0.0 /100 | #331 | Tragic 14.4% |
| Pueblo | 0.0 /100 | #332 | Tragic 14.4% |
| Cajuns | 0.0 /100 | #333 | Tragic 14.6% |
| Yuman | 0.0 /100 | #334 | Tragic 14.6% |
| Tohono O'odham | 0.0 /100 | #335 | Tragic 14.8% |
| Cherokee | 0.0 /100 | #336 | Tragic 14.8% |
| Seminole | 0.0 /100 | #337 | Tragic 14.9% |
| Dutch West Indians | 0.0 /100 | #338 | Tragic 14.9% |
| Chickasaw | 0.0 /100 | #339 | Tragic 15.2% |
| Choctaw | 0.0 /100 | #340 | Tragic 15.4% |