Immigrants from Northern Europe vs U.S. Virgin Islander Disability Age Under 5
COMPARE
Immigrants from Northern Europe
U.S. Virgin Islander
Disability Age Under 5
Disability Age Under 5 Comparison
Immigrants from Northern Europe
U.S. Virgin Islanders
1.3%
DISABILITY AGE UNDER 5
4.7/ 100
METRIC RATING
231st/ 347
METRIC RANK
1.3%
DISABILITY AGE UNDER 5
34.4/ 100
METRIC RATING
195th/ 347
METRIC RANK
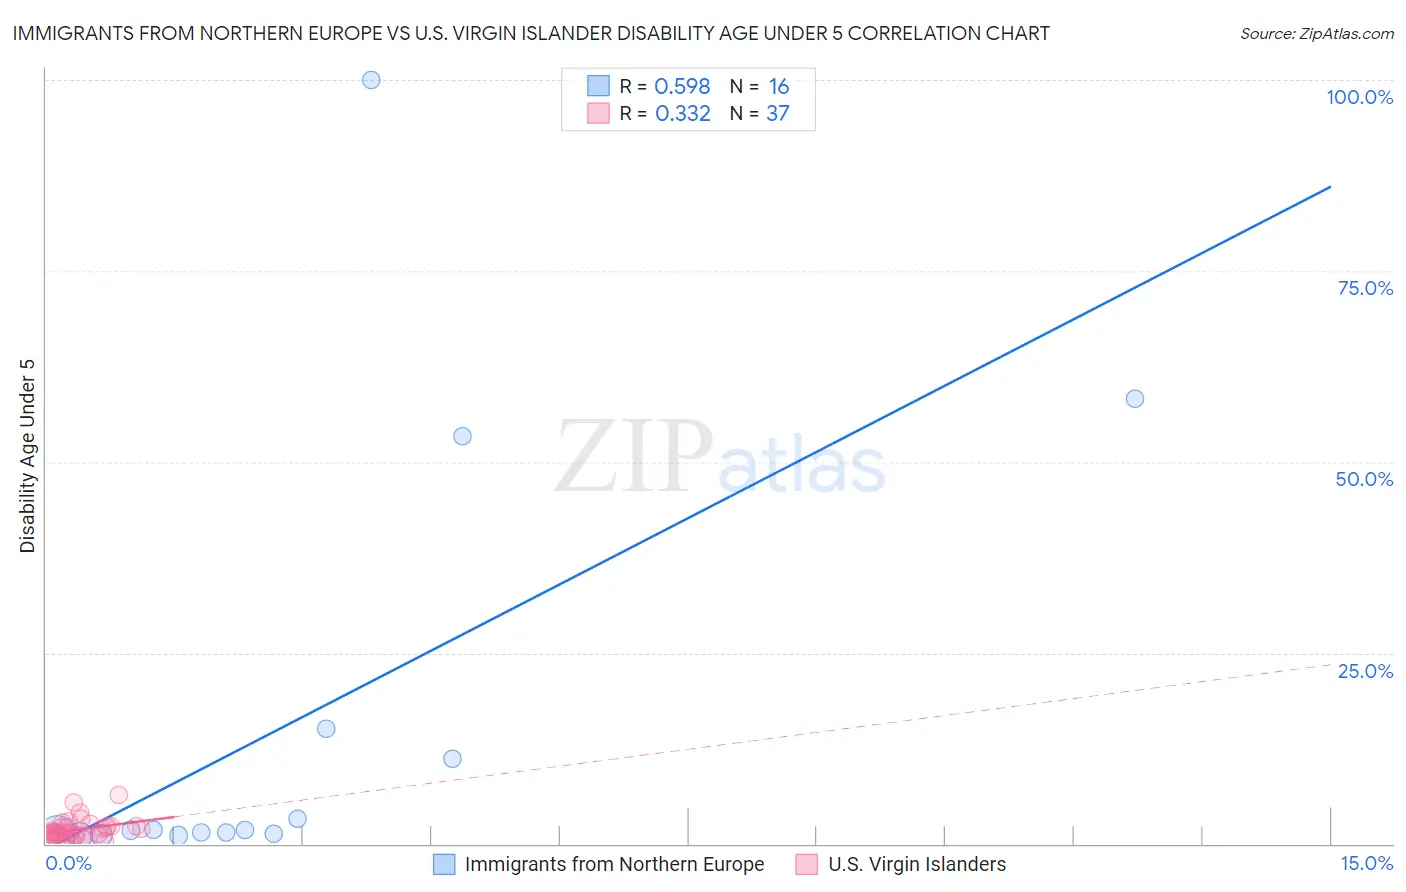
Immigrants from Northern Europe vs U.S. Virgin Islander Disability Age Under 5 Correlation Chart
The statistical analysis conducted on geographies consisting of 239,120,906 people shows a substantial positive correlation between the proportion of Immigrants from Northern Europe and percentage of population with a disability under the age of 5 in the United States with a correlation coefficient (R) of 0.598 and weighted average of 1.3%. Similarly, the statistical analysis conducted on geographies consisting of 67,886,708 people shows a mild positive correlation between the proportion of U.S. Virgin Islanders and percentage of population with a disability under the age of 5 in the United States with a correlation coefficient (R) of 0.332 and weighted average of 1.3%, a difference of 5.3%.
Disability Age Under 5 Correlation Summary
| Measurement | Immigrants from Northern Europe | U.S. Virgin Islander |
| Minimum | 1.1% | 0.26% |
| Maximum | 100.0% | 6.4% |
| Range | 98.9% | 6.1% |
| Mean | 16.0% | 1.8% |
| Median | 1.8% | 1.5% |
| Interquartile 25% (IQ1) | 1.3% | 0.94% |
| Interquartile 75% (IQ3) | 13.1% | 2.3% |
| Interquartile Range (IQR) | 11.8% | 1.3% |
| Standard Deviation (Sample) | 28.9% | 1.3% |
| Standard Deviation (Population) | 28.0% | 1.3% |
Similar Demographics by Disability Age Under 5
Demographics Similar to Immigrants from Northern Europe by Disability Age Under 5
In terms of disability age under 5, the demographic groups most similar to Immigrants from Northern Europe are French American Indian (1.3%, a difference of 0.13%), Lebanese (1.3%, a difference of 0.25%), Tongan (1.3%, a difference of 0.25%), Immigrants from Costa Rica (1.3%, a difference of 0.34%), and Pueblo (1.3%, a difference of 0.51%).
| Demographics | Rating | Rank | Disability Age Under 5 |
| Latvians | 7.1 /100 | #224 | Tragic 1.3% |
| Panamanians | 7.1 /100 | #225 | Tragic 1.3% |
| Bahamians | 7.1 /100 | #226 | Tragic 1.3% |
| Taiwanese | 6.1 /100 | #227 | Tragic 1.3% |
| Luxembourgers | 6.1 /100 | #228 | Tragic 1.3% |
| Immigrants | Costa Rica | 5.5 /100 | #229 | Tragic 1.3% |
| Lebanese | 5.3 /100 | #230 | Tragic 1.3% |
| Immigrants | Northern Europe | 4.7 /100 | #231 | Tragic 1.3% |
| French American Indians | 4.5 /100 | #232 | Tragic 1.3% |
| Tongans | 4.2 /100 | #233 | Tragic 1.3% |
| Pueblo | 3.8 /100 | #234 | Tragic 1.3% |
| Central American Indians | 3.6 /100 | #235 | Tragic 1.3% |
| South American Indians | 3.3 /100 | #236 | Tragic 1.3% |
| Basques | 3.0 /100 | #237 | Tragic 1.3% |
| Spanish American Indians | 2.4 /100 | #238 | Tragic 1.3% |
Demographics Similar to U.S. Virgin Islanders by Disability Age Under 5
In terms of disability age under 5, the demographic groups most similar to U.S. Virgin Islanders are Immigrants from North Macedonia (1.3%, a difference of 0.020%), Immigrants from Sierra Leone (1.3%, a difference of 0.20%), Mexican American Indian (1.3%, a difference of 0.21%), Immigrants from Bosnia and Herzegovina (1.3%, a difference of 0.21%), and Immigrants from Laos (1.3%, a difference of 0.22%).
| Demographics | Rating | Rank | Disability Age Under 5 |
| Haitians | 39.9 /100 | #188 | Fair 1.3% |
| Peruvians | 37.6 /100 | #189 | Fair 1.3% |
| Immigrants | Laos | 36.6 /100 | #190 | Fair 1.3% |
| Mexican American Indians | 36.6 /100 | #191 | Fair 1.3% |
| Immigrants | Bosnia and Herzegovina | 36.5 /100 | #192 | Fair 1.3% |
| Immigrants | Sierra Leone | 36.5 /100 | #193 | Fair 1.3% |
| Immigrants | North Macedonia | 34.7 /100 | #194 | Fair 1.3% |
| U.S. Virgin Islanders | 34.4 /100 | #195 | Fair 1.3% |
| Immigrants | Belgium | 31.4 /100 | #196 | Fair 1.3% |
| Immigrants | Somalia | 31.3 /100 | #197 | Fair 1.3% |
| Immigrants | Norway | 31.1 /100 | #198 | Fair 1.3% |
| Jamaicans | 30.7 /100 | #199 | Fair 1.3% |
| Immigrants | Lithuania | 27.2 /100 | #200 | Fair 1.3% |
| Immigrants | Italy | 25.4 /100 | #201 | Fair 1.3% |
| Arapaho | 24.1 /100 | #202 | Fair 1.3% |