Immigrants from Northern Europe vs Immigrants from Dominica Disability Age Under 5
COMPARE
Immigrants from Northern Europe
Immigrants from Dominica
Disability Age Under 5
Disability Age Under 5 Comparison
Immigrants from Northern Europe
Immigrants from Dominica
1.3%
DISABILITY AGE UNDER 5
4.7/ 100
METRIC RATING
231st/ 347
METRIC RANK
1.4%
DISABILITY AGE UNDER 5
0.2/ 100
METRIC RATING
262nd/ 347
METRIC RANK
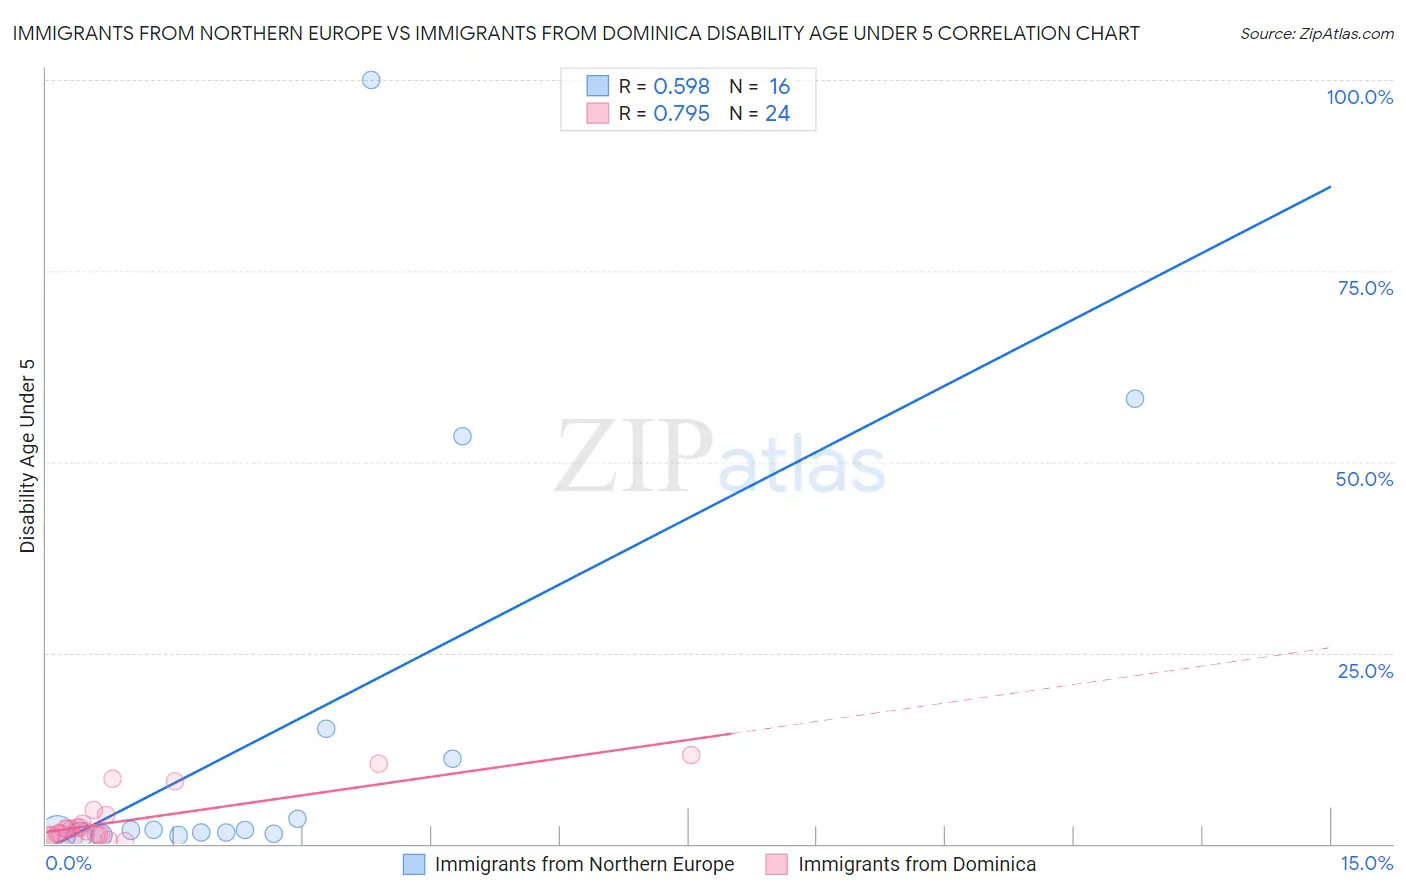
Immigrants from Northern Europe vs Immigrants from Dominica Disability Age Under 5 Correlation Chart
The statistical analysis conducted on geographies consisting of 239,120,906 people shows a substantial positive correlation between the proportion of Immigrants from Northern Europe and percentage of population with a disability under the age of 5 in the United States with a correlation coefficient (R) of 0.598 and weighted average of 1.3%. Similarly, the statistical analysis conducted on geographies consisting of 63,480,802 people shows a strong positive correlation between the proportion of Immigrants from Dominica and percentage of population with a disability under the age of 5 in the United States with a correlation coefficient (R) of 0.795 and weighted average of 1.4%, a difference of 7.2%.
Disability Age Under 5 Correlation Summary
| Measurement | Immigrants from Northern Europe | Immigrants from Dominica |
| Minimum | 1.1% | 0.41% |
| Maximum | 100.0% | 11.6% |
| Range | 98.9% | 11.2% |
| Mean | 16.0% | 3.0% |
| Median | 1.8% | 1.8% |
| Interquartile 25% (IQ1) | 1.3% | 1.1% |
| Interquartile 75% (IQ3) | 13.1% | 3.2% |
| Interquartile Range (IQR) | 11.8% | 2.1% |
| Standard Deviation (Sample) | 28.9% | 3.3% |
| Standard Deviation (Population) | 28.0% | 3.2% |
Similar Demographics by Disability Age Under 5
Demographics Similar to Immigrants from Northern Europe by Disability Age Under 5
In terms of disability age under 5, the demographic groups most similar to Immigrants from Northern Europe are French American Indian (1.3%, a difference of 0.13%), Lebanese (1.3%, a difference of 0.25%), Tongan (1.3%, a difference of 0.25%), Immigrants from Costa Rica (1.3%, a difference of 0.34%), and Pueblo (1.3%, a difference of 0.51%).
| Demographics | Rating | Rank | Disability Age Under 5 |
| Latvians | 7.1 /100 | #224 | Tragic 1.3% |
| Panamanians | 7.1 /100 | #225 | Tragic 1.3% |
| Bahamians | 7.1 /100 | #226 | Tragic 1.3% |
| Taiwanese | 6.1 /100 | #227 | Tragic 1.3% |
| Luxembourgers | 6.1 /100 | #228 | Tragic 1.3% |
| Immigrants | Costa Rica | 5.5 /100 | #229 | Tragic 1.3% |
| Lebanese | 5.3 /100 | #230 | Tragic 1.3% |
| Immigrants | Northern Europe | 4.7 /100 | #231 | Tragic 1.3% |
| French American Indians | 4.5 /100 | #232 | Tragic 1.3% |
| Tongans | 4.2 /100 | #233 | Tragic 1.3% |
| Pueblo | 3.8 /100 | #234 | Tragic 1.3% |
| Central American Indians | 3.6 /100 | #235 | Tragic 1.3% |
| South American Indians | 3.3 /100 | #236 | Tragic 1.3% |
| Basques | 3.0 /100 | #237 | Tragic 1.3% |
| Spanish American Indians | 2.4 /100 | #238 | Tragic 1.3% |
Demographics Similar to Immigrants from Dominica by Disability Age Under 5
In terms of disability age under 5, the demographic groups most similar to Immigrants from Dominica are Spanish (1.4%, a difference of 0.060%), Immigrants from Netherlands (1.4%, a difference of 0.16%), Yugoslavian (1.4%, a difference of 0.21%), Carpatho Rusyn (1.4%, a difference of 0.25%), and Immigrants from Germany (1.4%, a difference of 0.28%).
| Demographics | Rating | Rank | Disability Age Under 5 |
| Immigrants | Liberia | 0.6 /100 | #255 | Tragic 1.4% |
| Immigrants | Western Europe | 0.5 /100 | #256 | Tragic 1.4% |
| Slovenes | 0.3 /100 | #257 | Tragic 1.4% |
| Costa Ricans | 0.3 /100 | #258 | Tragic 1.4% |
| Immigrants | Southern Europe | 0.3 /100 | #259 | Tragic 1.4% |
| Slavs | 0.3 /100 | #260 | Tragic 1.4% |
| Immigrants | Netherlands | 0.2 /100 | #261 | Tragic 1.4% |
| Immigrants | Dominica | 0.2 /100 | #262 | Tragic 1.4% |
| Spanish | 0.2 /100 | #263 | Tragic 1.4% |
| Yugoslavians | 0.1 /100 | #264 | Tragic 1.4% |
| Carpatho Rusyns | 0.1 /100 | #265 | Tragic 1.4% |
| Immigrants | Germany | 0.1 /100 | #266 | Tragic 1.4% |
| Cree | 0.1 /100 | #267 | Tragic 1.4% |
| Belgians | 0.1 /100 | #268 | Tragic 1.4% |
| Austrians | 0.1 /100 | #269 | Tragic 1.4% |