Immigrants from Northern Africa vs Panamanian Hearing Disability
COMPARE
Immigrants from Northern Africa
Panamanian
Hearing Disability
Hearing Disability Comparison
Immigrants from Northern Africa
Panamanians
2.8%
HEARING DISABILITY
96.9/ 100
METRIC RATING
85th/ 347
METRIC RANK
3.0%
HEARING DISABILITY
47.0/ 100
METRIC RATING
176th/ 347
METRIC RANK
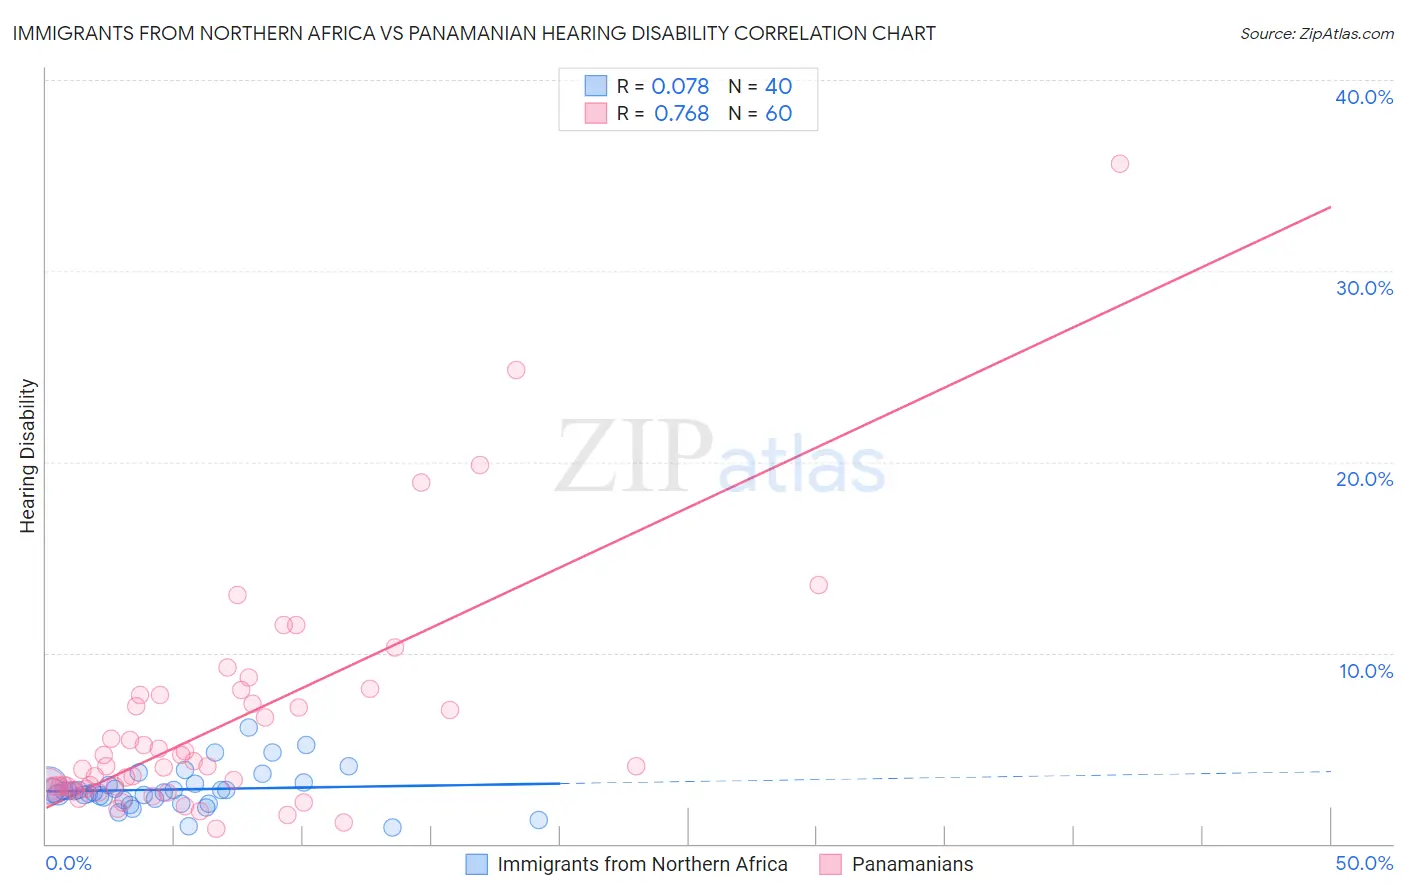
Immigrants from Northern Africa vs Panamanian Hearing Disability Correlation Chart
The statistical analysis conducted on geographies consisting of 321,108,850 people shows a slight positive correlation between the proportion of Immigrants from Northern Africa and percentage of population with hearing disability in the United States with a correlation coefficient (R) of 0.078 and weighted average of 2.8%. Similarly, the statistical analysis conducted on geographies consisting of 281,114,071 people shows a strong positive correlation between the proportion of Panamanians and percentage of population with hearing disability in the United States with a correlation coefficient (R) of 0.768 and weighted average of 3.0%, a difference of 9.1%.
Hearing Disability Correlation Summary
| Measurement | Immigrants from Northern Africa | Panamanian |
| Minimum | 0.86% | 0.76% |
| Maximum | 6.1% | 35.6% |
| Range | 5.3% | 34.9% |
| Mean | 2.8% | 6.2% |
| Median | 2.8% | 4.0% |
| Interquartile 25% (IQ1) | 2.3% | 2.9% |
| Interquartile 75% (IQ3) | 3.1% | 7.6% |
| Interquartile Range (IQR) | 0.81% | 4.7% |
| Standard Deviation (Sample) | 1.1% | 6.1% |
| Standard Deviation (Population) | 1.1% | 6.0% |
Similar Demographics by Hearing Disability
Demographics Similar to Immigrants from Northern Africa by Hearing Disability
In terms of hearing disability, the demographic groups most similar to Immigrants from Northern Africa are Immigrants from Iran (2.8%, a difference of 0.020%), Immigrants from Argentina (2.8%, a difference of 0.070%), Somali (2.8%, a difference of 0.13%), Immigrants from Turkey (2.8%, a difference of 0.17%), and Belizean (2.8%, a difference of 0.20%).
| Demographics | Rating | Rank | Hearing Disability |
| Mongolians | 97.4 /100 | #78 | Exceptional 2.7% |
| Colombians | 97.4 /100 | #79 | Exceptional 2.7% |
| Immigrants | Asia | 97.2 /100 | #80 | Exceptional 2.7% |
| Immigrants | Uruguay | 97.2 /100 | #81 | Exceptional 2.7% |
| Immigrants | Armenia | 97.2 /100 | #82 | Exceptional 2.7% |
| Immigrants | Cuba | 97.2 /100 | #83 | Exceptional 2.7% |
| Immigrants | Argentina | 97.0 /100 | #84 | Exceptional 2.8% |
| Immigrants | Northern Africa | 96.9 /100 | #85 | Exceptional 2.8% |
| Immigrants | Iran | 96.8 /100 | #86 | Exceptional 2.8% |
| Somalis | 96.7 /100 | #87 | Exceptional 2.8% |
| Immigrants | Turkey | 96.7 /100 | #88 | Exceptional 2.8% |
| Belizeans | 96.6 /100 | #89 | Exceptional 2.8% |
| Immigrants | Morocco | 96.6 /100 | #90 | Exceptional 2.8% |
| Immigrants | Middle Africa | 96.5 /100 | #91 | Exceptional 2.8% |
| Iranians | 96.4 /100 | #92 | Exceptional 2.8% |
Demographics Similar to Panamanians by Hearing Disability
In terms of hearing disability, the demographic groups most similar to Panamanians are Immigrants from Philippines (3.0%, a difference of 0.060%), Japanese (3.0%, a difference of 0.10%), Immigrants from Romania (3.0%, a difference of 0.14%), Indonesian (3.0%, a difference of 0.28%), and Immigrants from Moldova (3.0%, a difference of 0.37%).
| Demographics | Rating | Rank | Hearing Disability |
| Arabs | 57.6 /100 | #169 | Average 3.0% |
| Immigrants | Cabo Verde | 56.9 /100 | #170 | Average 3.0% |
| Immigrants | Ukraine | 56.6 /100 | #171 | Average 3.0% |
| Armenians | 56.0 /100 | #172 | Average 3.0% |
| Immigrants | Serbia | 51.1 /100 | #173 | Average 3.0% |
| Indonesians | 50.0 /100 | #174 | Average 3.0% |
| Immigrants | Romania | 48.4 /100 | #175 | Average 3.0% |
| Panamanians | 47.0 /100 | #176 | Average 3.0% |
| Immigrants | Philippines | 46.4 /100 | #177 | Average 3.0% |
| Japanese | 46.0 /100 | #178 | Average 3.0% |
| Immigrants | Moldova | 43.1 /100 | #179 | Average 3.0% |
| Immigrants | Sweden | 42.4 /100 | #180 | Average 3.0% |
| Immigrants | Belgium | 41.5 /100 | #181 | Average 3.0% |
| Immigrants | Italy | 41.1 /100 | #182 | Average 3.0% |
| Bulgarians | 39.7 /100 | #183 | Fair 3.0% |