Yup'ik vs Panamanian Hearing Disability
COMPARE
Yup'ik
Panamanian
Hearing Disability
Hearing Disability Comparison
Yup'ik
Panamanians
5.8%
HEARING DISABILITY
0.0/ 100
METRIC RATING
347th/ 347
METRIC RANK
3.0%
HEARING DISABILITY
47.0/ 100
METRIC RATING
176th/ 347
METRIC RANK
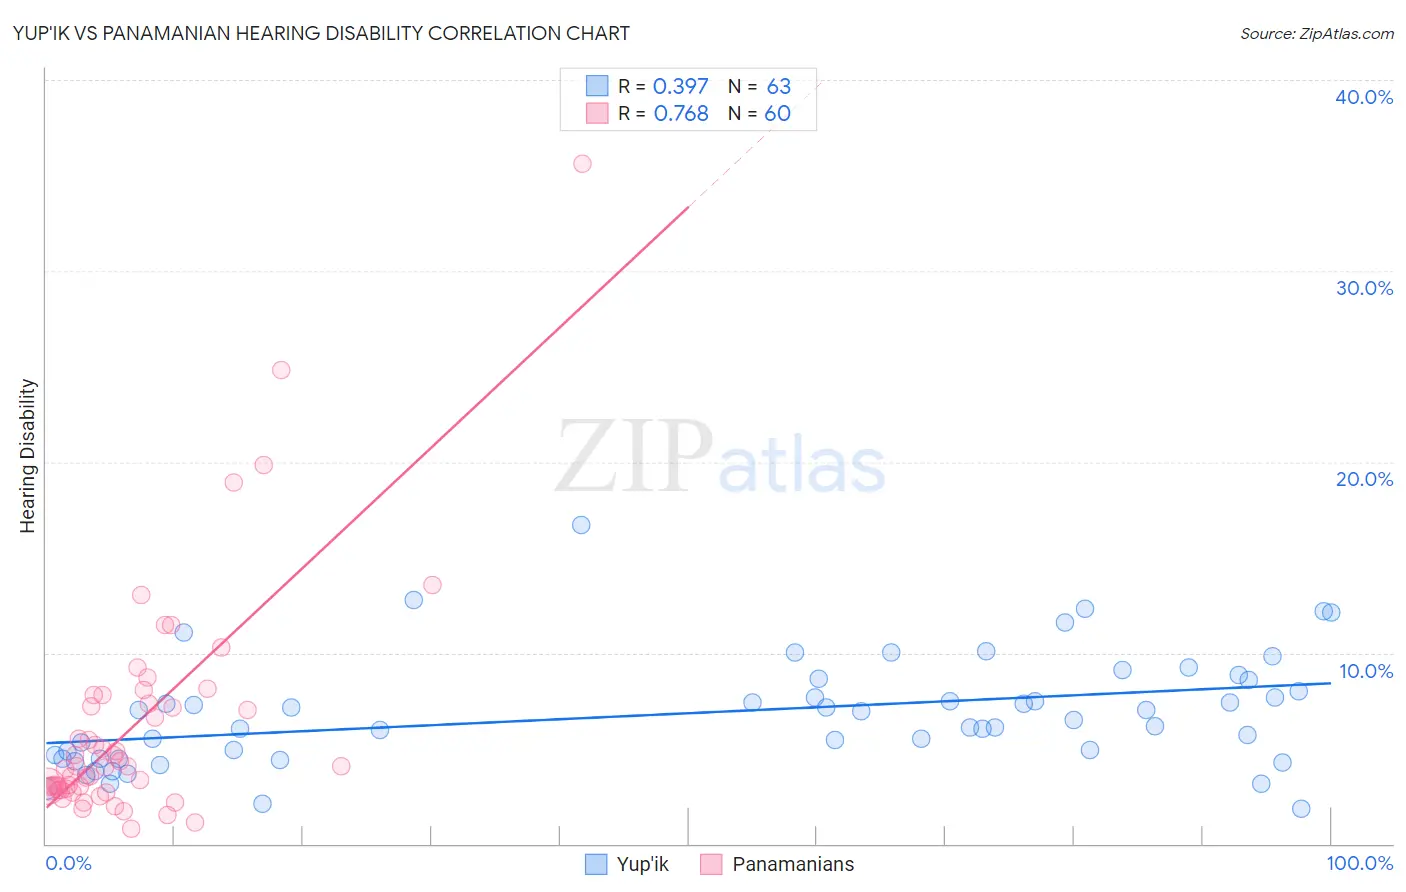
Yup'ik vs Panamanian Hearing Disability Correlation Chart
The statistical analysis conducted on geographies consisting of 39,958,202 people shows a mild positive correlation between the proportion of Yup'ik and percentage of population with hearing disability in the United States with a correlation coefficient (R) of 0.397 and weighted average of 5.8%. Similarly, the statistical analysis conducted on geographies consisting of 281,114,071 people shows a strong positive correlation between the proportion of Panamanians and percentage of population with hearing disability in the United States with a correlation coefficient (R) of 0.768 and weighted average of 3.0%, a difference of 94.5%.
Hearing Disability Correlation Summary
| Measurement | Yup'ik | Panamanian |
| Minimum | 1.9% | 0.76% |
| Maximum | 16.7% | 35.6% |
| Range | 14.8% | 34.9% |
| Mean | 6.8% | 6.2% |
| Median | 6.5% | 4.0% |
| Interquartile 25% (IQ1) | 4.5% | 2.9% |
| Interquartile 75% (IQ3) | 8.5% | 7.6% |
| Interquartile Range (IQR) | 4.1% | 4.7% |
| Standard Deviation (Sample) | 2.9% | 6.1% |
| Standard Deviation (Population) | 2.9% | 6.0% |
Similar Demographics by Hearing Disability
Demographics Similar to Yup'ik by Hearing Disability
In terms of hearing disability, the demographic groups most similar to Yup'ik are Colville (5.3%, a difference of 9.3%), Alaskan Athabascan (5.3%, a difference of 9.7%), Tlingit-Haida (4.8%, a difference of 20.6%), Inupiat (4.7%, a difference of 23.9%), and Tsimshian (4.7%, a difference of 24.2%).
| Demographics | Rating | Rank | Hearing Disability |
| Dutch West Indians | 0.0 /100 | #333 | Tragic 4.3% |
| Aleuts | 0.0 /100 | #334 | Tragic 4.3% |
| Kiowa | 0.0 /100 | #335 | Tragic 4.3% |
| Creek | 0.0 /100 | #336 | Tragic 4.4% |
| Chickasaw | 0.0 /100 | #337 | Tragic 4.5% |
| Alaska Natives | 0.0 /100 | #338 | Tragic 4.5% |
| Choctaw | 0.0 /100 | #339 | Tragic 4.5% |
| Pueblo | 0.0 /100 | #340 | Tragic 4.6% |
| Navajo | 0.0 /100 | #341 | Tragic 4.6% |
| Tsimshian | 0.0 /100 | #342 | Tragic 4.7% |
| Inupiat | 0.0 /100 | #343 | Tragic 4.7% |
| Tlingit-Haida | 0.0 /100 | #344 | Tragic 4.8% |
| Alaskan Athabascans | 0.0 /100 | #345 | Tragic 5.3% |
| Colville | 0.0 /100 | #346 | Tragic 5.3% |
| Yup'ik | 0.0 /100 | #347 | Tragic 5.8% |
Demographics Similar to Panamanians by Hearing Disability
In terms of hearing disability, the demographic groups most similar to Panamanians are Immigrants from Philippines (3.0%, a difference of 0.060%), Japanese (3.0%, a difference of 0.10%), Immigrants from Romania (3.0%, a difference of 0.14%), Indonesian (3.0%, a difference of 0.28%), and Immigrants from Moldova (3.0%, a difference of 0.37%).
| Demographics | Rating | Rank | Hearing Disability |
| Arabs | 57.6 /100 | #169 | Average 3.0% |
| Immigrants | Cabo Verde | 56.9 /100 | #170 | Average 3.0% |
| Immigrants | Ukraine | 56.6 /100 | #171 | Average 3.0% |
| Armenians | 56.0 /100 | #172 | Average 3.0% |
| Immigrants | Serbia | 51.1 /100 | #173 | Average 3.0% |
| Indonesians | 50.0 /100 | #174 | Average 3.0% |
| Immigrants | Romania | 48.4 /100 | #175 | Average 3.0% |
| Panamanians | 47.0 /100 | #176 | Average 3.0% |
| Immigrants | Philippines | 46.4 /100 | #177 | Average 3.0% |
| Japanese | 46.0 /100 | #178 | Average 3.0% |
| Immigrants | Moldova | 43.1 /100 | #179 | Average 3.0% |
| Immigrants | Sweden | 42.4 /100 | #180 | Average 3.0% |
| Immigrants | Belgium | 41.5 /100 | #181 | Average 3.0% |
| Immigrants | Italy | 41.1 /100 | #182 | Average 3.0% |
| Bulgarians | 39.7 /100 | #183 | Fair 3.0% |