Immigrants from Spain vs Panamanian Hearing Disability
COMPARE
Immigrants from Spain
Panamanian
Hearing Disability
Hearing Disability Comparison
Immigrants from Spain
Panamanians
2.8%
HEARING DISABILITY
94.9/ 100
METRIC RATING
101st/ 347
METRIC RANK
3.0%
HEARING DISABILITY
47.0/ 100
METRIC RATING
176th/ 347
METRIC RANK
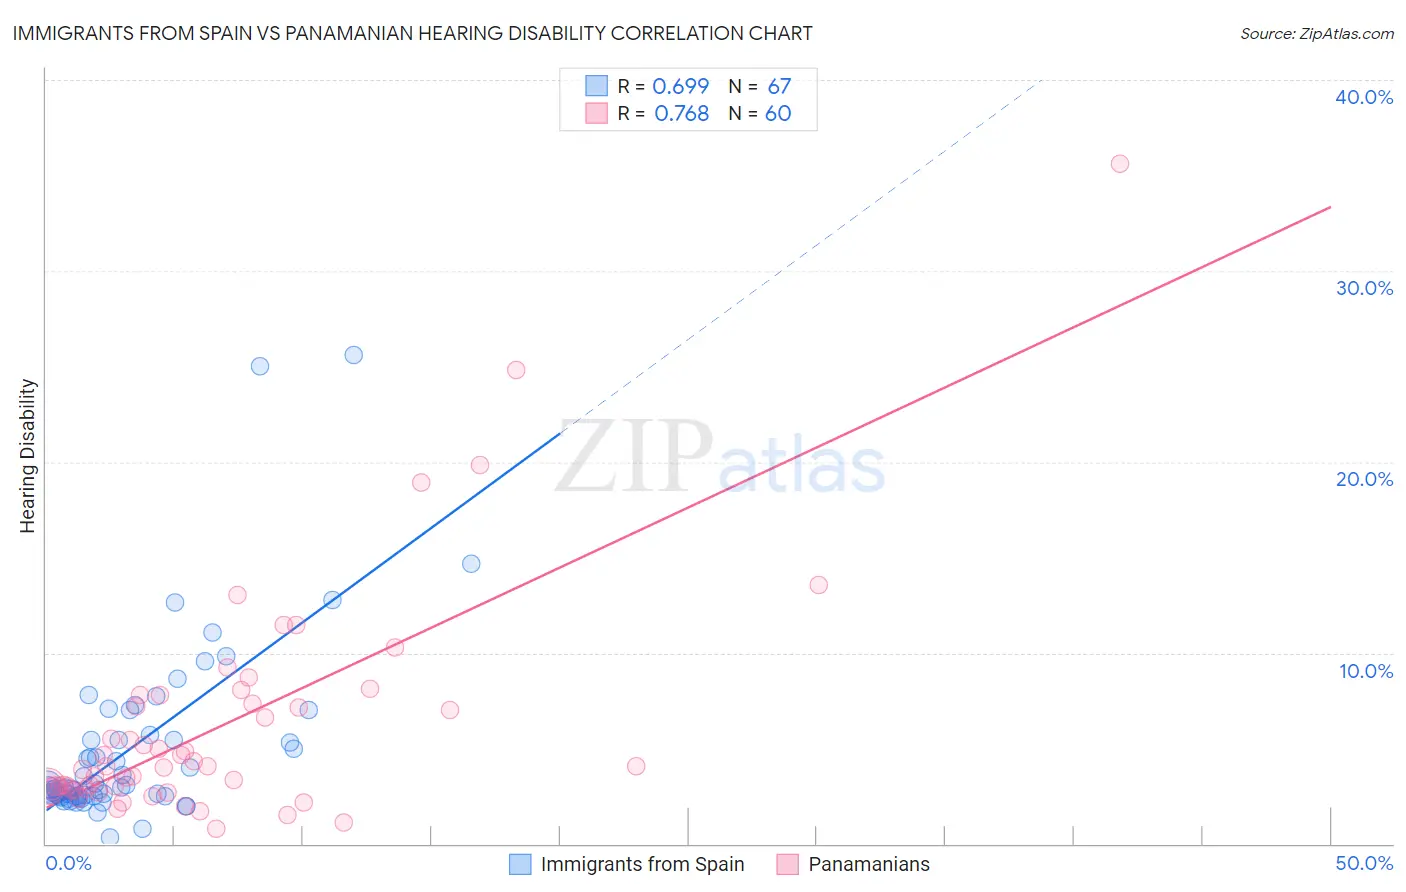
Immigrants from Spain vs Panamanian Hearing Disability Correlation Chart
The statistical analysis conducted on geographies consisting of 239,646,131 people shows a significant positive correlation between the proportion of Immigrants from Spain and percentage of population with hearing disability in the United States with a correlation coefficient (R) of 0.699 and weighted average of 2.8%. Similarly, the statistical analysis conducted on geographies consisting of 281,114,071 people shows a strong positive correlation between the proportion of Panamanians and percentage of population with hearing disability in the United States with a correlation coefficient (R) of 0.768 and weighted average of 3.0%, a difference of 7.6%.
Hearing Disability Correlation Summary
| Measurement | Immigrants from Spain | Panamanian |
| Minimum | 0.32% | 0.76% |
| Maximum | 25.6% | 35.6% |
| Range | 25.3% | 34.9% |
| Mean | 4.9% | 6.2% |
| Median | 2.9% | 4.0% |
| Interquartile 25% (IQ1) | 2.5% | 2.9% |
| Interquartile 75% (IQ3) | 5.4% | 7.6% |
| Interquartile Range (IQR) | 2.9% | 4.7% |
| Standard Deviation (Sample) | 4.7% | 6.1% |
| Standard Deviation (Population) | 4.6% | 6.0% |
Similar Demographics by Hearing Disability
Demographics Similar to Immigrants from Spain by Hearing Disability
In terms of hearing disability, the demographic groups most similar to Immigrants from Spain are Taiwanese (2.8%, a difference of 0.010%), Immigrants from Eastern Africa (2.8%, a difference of 0.050%), Immigrants from Indonesia (2.8%, a difference of 0.060%), Immigrants from Guatemala (2.8%, a difference of 0.11%), and Immigrants from Honduras (2.8%, a difference of 0.15%).
| Demographics | Rating | Rank | Hearing Disability |
| Uruguayans | 95.9 /100 | #94 | Exceptional 2.8% |
| Israelis | 95.9 /100 | #95 | Exceptional 2.8% |
| Immigrants | Somalia | 95.5 /100 | #96 | Exceptional 2.8% |
| Immigrants | Afghanistan | 95.3 /100 | #97 | Exceptional 2.8% |
| Immigrants | Honduras | 95.1 /100 | #98 | Exceptional 2.8% |
| Immigrants | Guatemala | 95.1 /100 | #99 | Exceptional 2.8% |
| Immigrants | Eastern Africa | 95.0 /100 | #100 | Exceptional 2.8% |
| Immigrants | Spain | 94.9 /100 | #101 | Exceptional 2.8% |
| Taiwanese | 94.8 /100 | #102 | Exceptional 2.8% |
| Immigrants | Indonesia | 94.7 /100 | #103 | Exceptional 2.8% |
| Burmese | 94.2 /100 | #104 | Exceptional 2.8% |
| Moroccans | 93.9 /100 | #105 | Exceptional 2.8% |
| Hondurans | 93.4 /100 | #106 | Exceptional 2.8% |
| Immigrants | Chile | 93.4 /100 | #107 | Exceptional 2.8% |
| Guatemalans | 93.2 /100 | #108 | Exceptional 2.8% |
Demographics Similar to Panamanians by Hearing Disability
In terms of hearing disability, the demographic groups most similar to Panamanians are Immigrants from Philippines (3.0%, a difference of 0.060%), Japanese (3.0%, a difference of 0.10%), Immigrants from Romania (3.0%, a difference of 0.14%), Indonesian (3.0%, a difference of 0.28%), and Immigrants from Moldova (3.0%, a difference of 0.37%).
| Demographics | Rating | Rank | Hearing Disability |
| Arabs | 57.6 /100 | #169 | Average 3.0% |
| Immigrants | Cabo Verde | 56.9 /100 | #170 | Average 3.0% |
| Immigrants | Ukraine | 56.6 /100 | #171 | Average 3.0% |
| Armenians | 56.0 /100 | #172 | Average 3.0% |
| Immigrants | Serbia | 51.1 /100 | #173 | Average 3.0% |
| Indonesians | 50.0 /100 | #174 | Average 3.0% |
| Immigrants | Romania | 48.4 /100 | #175 | Average 3.0% |
| Panamanians | 47.0 /100 | #176 | Average 3.0% |
| Immigrants | Philippines | 46.4 /100 | #177 | Average 3.0% |
| Japanese | 46.0 /100 | #178 | Average 3.0% |
| Immigrants | Moldova | 43.1 /100 | #179 | Average 3.0% |
| Immigrants | Sweden | 42.4 /100 | #180 | Average 3.0% |
| Immigrants | Belgium | 41.5 /100 | #181 | Average 3.0% |
| Immigrants | Italy | 41.1 /100 | #182 | Average 3.0% |
| Bulgarians | 39.7 /100 | #183 | Fair 3.0% |