Immigrants from Northern Africa vs Immigrants from Trinidad and Tobago Hearing Disability
COMPARE
Immigrants from Northern Africa
Immigrants from Trinidad and Tobago
Hearing Disability
Hearing Disability Comparison
Immigrants from Northern Africa
Immigrants from Trinidad and Tobago
2.8%
HEARING DISABILITY
96.9/ 100
METRIC RATING
85th/ 347
METRIC RANK
2.5%
HEARING DISABILITY
99.9/ 100
METRIC RATING
11th/ 347
METRIC RANK
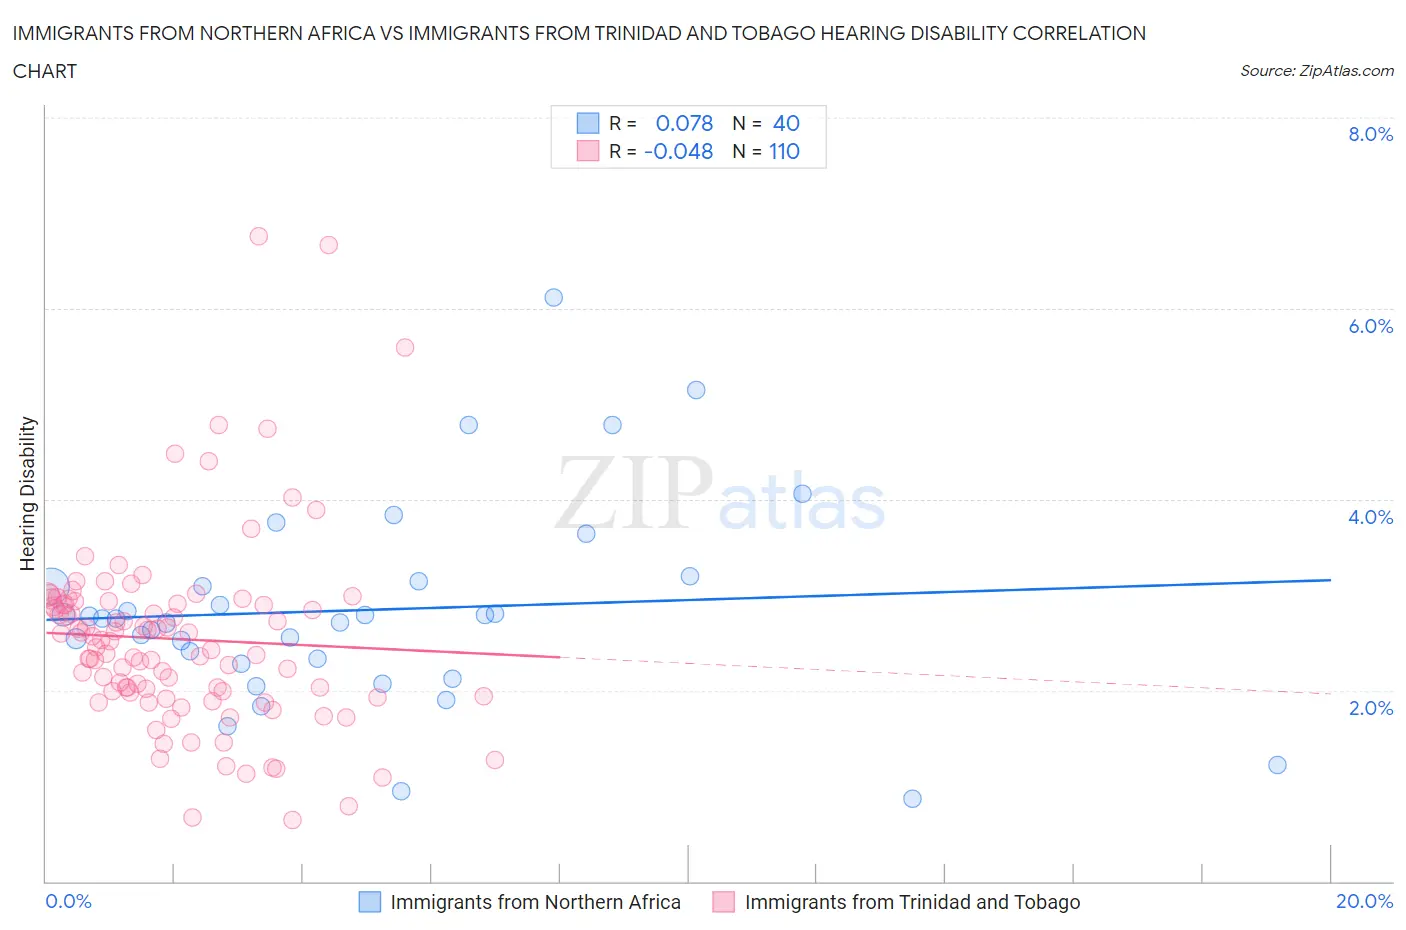
Immigrants from Northern Africa vs Immigrants from Trinidad and Tobago Hearing Disability Correlation Chart
The statistical analysis conducted on geographies consisting of 321,108,850 people shows a slight positive correlation between the proportion of Immigrants from Northern Africa and percentage of population with hearing disability in the United States with a correlation coefficient (R) of 0.078 and weighted average of 2.8%. Similarly, the statistical analysis conducted on geographies consisting of 223,480,076 people shows no correlation between the proportion of Immigrants from Trinidad and Tobago and percentage of population with hearing disability in the United States with a correlation coefficient (R) of -0.048 and weighted average of 2.5%, a difference of 10.7%.
Hearing Disability Correlation Summary
| Measurement | Immigrants from Northern Africa | Immigrants from Trinidad and Tobago |
| Minimum | 0.86% | 0.64% |
| Maximum | 6.1% | 6.8% |
| Range | 5.3% | 6.1% |
| Mean | 2.8% | 2.5% |
| Median | 2.8% | 2.5% |
| Interquartile 25% (IQ1) | 2.3% | 2.0% |
| Interquartile 75% (IQ3) | 3.1% | 2.9% |
| Interquartile Range (IQR) | 0.81% | 0.93% |
| Standard Deviation (Sample) | 1.1% | 1.0% |
| Standard Deviation (Population) | 1.1% | 1.0% |
Similar Demographics by Hearing Disability
Demographics Similar to Immigrants from Northern Africa by Hearing Disability
In terms of hearing disability, the demographic groups most similar to Immigrants from Northern Africa are Immigrants from Iran (2.8%, a difference of 0.020%), Immigrants from Argentina (2.8%, a difference of 0.070%), Somali (2.8%, a difference of 0.13%), Immigrants from Turkey (2.8%, a difference of 0.17%), and Belizean (2.8%, a difference of 0.20%).
| Demographics | Rating | Rank | Hearing Disability |
| Mongolians | 97.4 /100 | #78 | Exceptional 2.7% |
| Colombians | 97.4 /100 | #79 | Exceptional 2.7% |
| Immigrants | Asia | 97.2 /100 | #80 | Exceptional 2.7% |
| Immigrants | Uruguay | 97.2 /100 | #81 | Exceptional 2.7% |
| Immigrants | Armenia | 97.2 /100 | #82 | Exceptional 2.7% |
| Immigrants | Cuba | 97.2 /100 | #83 | Exceptional 2.7% |
| Immigrants | Argentina | 97.0 /100 | #84 | Exceptional 2.8% |
| Immigrants | Northern Africa | 96.9 /100 | #85 | Exceptional 2.8% |
| Immigrants | Iran | 96.8 /100 | #86 | Exceptional 2.8% |
| Somalis | 96.7 /100 | #87 | Exceptional 2.8% |
| Immigrants | Turkey | 96.7 /100 | #88 | Exceptional 2.8% |
| Belizeans | 96.6 /100 | #89 | Exceptional 2.8% |
| Immigrants | Morocco | 96.6 /100 | #90 | Exceptional 2.8% |
| Immigrants | Middle Africa | 96.5 /100 | #91 | Exceptional 2.8% |
| Iranians | 96.4 /100 | #92 | Exceptional 2.8% |
Demographics Similar to Immigrants from Trinidad and Tobago by Hearing Disability
In terms of hearing disability, the demographic groups most similar to Immigrants from Trinidad and Tobago are Trinidadian and Tobagonian (2.5%, a difference of 0.30%), Sierra Leonean (2.5%, a difference of 0.53%), Immigrants from Ecuador (2.5%, a difference of 0.55%), Ecuadorian (2.5%, a difference of 0.85%), and Barbadian (2.5%, a difference of 1.1%).
| Demographics | Rating | Rank | Hearing Disability |
| Immigrants | Guyana | 100.0 /100 | #4 | Exceptional 2.3% |
| Immigrants | Barbados | 100.0 /100 | #5 | Exceptional 2.4% |
| Vietnamese | 100.0 /100 | #6 | Exceptional 2.4% |
| Immigrants | Bangladesh | 100.0 /100 | #7 | Exceptional 2.4% |
| British West Indians | 100.0 /100 | #8 | Exceptional 2.4% |
| Immigrants | Dominican Republic | 100.0 /100 | #9 | Exceptional 2.4% |
| Immigrants | Ecuador | 99.9 /100 | #10 | Exceptional 2.5% |
| Immigrants | Trinidad and Tobago | 99.9 /100 | #11 | Exceptional 2.5% |
| Trinidadians and Tobagonians | 99.9 /100 | #12 | Exceptional 2.5% |
| Sierra Leoneans | 99.9 /100 | #13 | Exceptional 2.5% |
| Ecuadorians | 99.9 /100 | #14 | Exceptional 2.5% |
| Barbadians | 99.9 /100 | #15 | Exceptional 2.5% |
| Immigrants | West Indies | 99.9 /100 | #16 | Exceptional 2.5% |
| Immigrants | India | 99.9 /100 | #17 | Exceptional 2.5% |
| Dominicans | 99.8 /100 | #18 | Exceptional 2.5% |