Immigrants from Taiwan vs Panamanian Hearing Disability
COMPARE
Immigrants from Taiwan
Panamanian
Hearing Disability
Hearing Disability Comparison
Immigrants from Taiwan
Panamanians
2.6%
HEARING DISABILITY
99.4/ 100
METRIC RATING
41st/ 347
METRIC RANK
3.0%
HEARING DISABILITY
47.0/ 100
METRIC RATING
176th/ 347
METRIC RANK
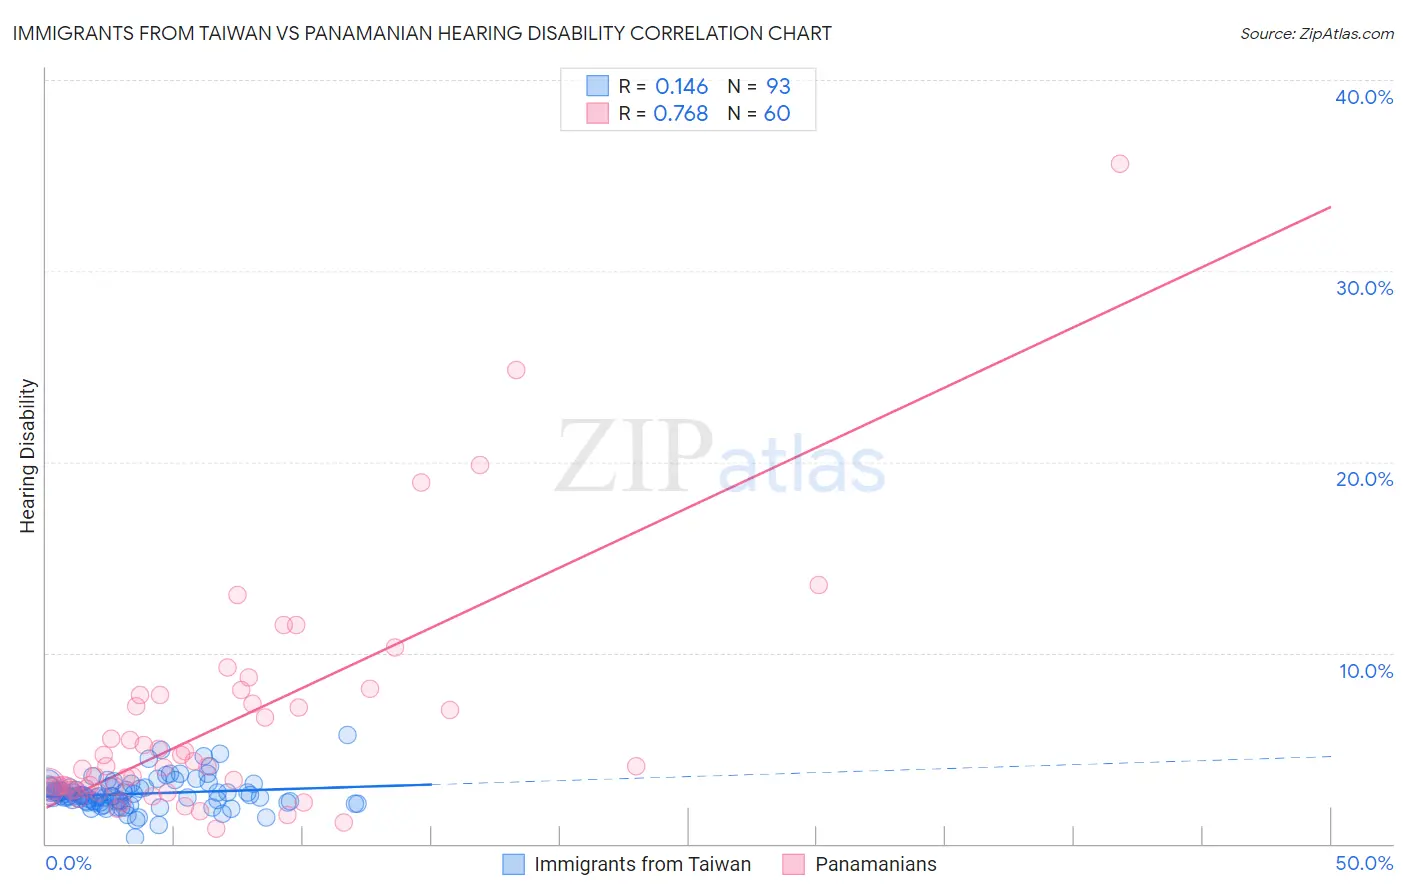
Immigrants from Taiwan vs Panamanian Hearing Disability Correlation Chart
The statistical analysis conducted on geographies consisting of 298,207,747 people shows a poor positive correlation between the proportion of Immigrants from Taiwan and percentage of population with hearing disability in the United States with a correlation coefficient (R) of 0.146 and weighted average of 2.6%. Similarly, the statistical analysis conducted on geographies consisting of 281,114,071 people shows a strong positive correlation between the proportion of Panamanians and percentage of population with hearing disability in the United States with a correlation coefficient (R) of 0.768 and weighted average of 3.0%, a difference of 14.0%.
Hearing Disability Correlation Summary
| Measurement | Immigrants from Taiwan | Panamanian |
| Minimum | 0.31% | 0.76% |
| Maximum | 5.7% | 35.6% |
| Range | 5.4% | 34.9% |
| Mean | 2.6% | 6.2% |
| Median | 2.5% | 4.0% |
| Interquartile 25% (IQ1) | 2.2% | 2.9% |
| Interquartile 75% (IQ3) | 3.0% | 7.6% |
| Interquartile Range (IQR) | 0.78% | 4.7% |
| Standard Deviation (Sample) | 0.82% | 6.1% |
| Standard Deviation (Population) | 0.82% | 6.0% |
Similar Demographics by Hearing Disability
Demographics Similar to Immigrants from Taiwan by Hearing Disability
In terms of hearing disability, the demographic groups most similar to Immigrants from Taiwan are West Indian (2.6%, a difference of 0.010%), Senegalese (2.6%, a difference of 0.010%), Nigerian (2.6%, a difference of 0.23%), Venezuelan (2.6%, a difference of 0.26%), and Haitian (2.6%, a difference of 0.34%).
| Demographics | Rating | Rank | Hearing Disability |
| Immigrants | Pakistan | 99.6 /100 | #34 | Exceptional 2.6% |
| Salvadorans | 99.6 /100 | #35 | Exceptional 2.6% |
| Okinawans | 99.6 /100 | #36 | Exceptional 2.6% |
| Immigrants | Western Africa | 99.6 /100 | #37 | Exceptional 2.6% |
| Immigrants | Jamaica | 99.5 /100 | #38 | Exceptional 2.6% |
| Immigrants | China | 99.5 /100 | #39 | Exceptional 2.6% |
| Haitians | 99.5 /100 | #40 | Exceptional 2.6% |
| Immigrants | Taiwan | 99.4 /100 | #41 | Exceptional 2.6% |
| West Indians | 99.4 /100 | #42 | Exceptional 2.6% |
| Senegalese | 99.4 /100 | #43 | Exceptional 2.6% |
| Nigerians | 99.4 /100 | #44 | Exceptional 2.6% |
| Venezuelans | 99.4 /100 | #45 | Exceptional 2.6% |
| Immigrants | Dominica | 99.3 /100 | #46 | Exceptional 2.6% |
| Immigrants | Israel | 99.3 /100 | #47 | Exceptional 2.6% |
| Immigrants | Singapore | 99.3 /100 | #48 | Exceptional 2.6% |
Demographics Similar to Panamanians by Hearing Disability
In terms of hearing disability, the demographic groups most similar to Panamanians are Immigrants from Philippines (3.0%, a difference of 0.060%), Japanese (3.0%, a difference of 0.10%), Immigrants from Romania (3.0%, a difference of 0.14%), Indonesian (3.0%, a difference of 0.28%), and Immigrants from Moldova (3.0%, a difference of 0.37%).
| Demographics | Rating | Rank | Hearing Disability |
| Arabs | 57.6 /100 | #169 | Average 3.0% |
| Immigrants | Cabo Verde | 56.9 /100 | #170 | Average 3.0% |
| Immigrants | Ukraine | 56.6 /100 | #171 | Average 3.0% |
| Armenians | 56.0 /100 | #172 | Average 3.0% |
| Immigrants | Serbia | 51.1 /100 | #173 | Average 3.0% |
| Indonesians | 50.0 /100 | #174 | Average 3.0% |
| Immigrants | Romania | 48.4 /100 | #175 | Average 3.0% |
| Panamanians | 47.0 /100 | #176 | Average 3.0% |
| Immigrants | Philippines | 46.4 /100 | #177 | Average 3.0% |
| Japanese | 46.0 /100 | #178 | Average 3.0% |
| Immigrants | Moldova | 43.1 /100 | #179 | Average 3.0% |
| Immigrants | Sweden | 42.4 /100 | #180 | Average 3.0% |
| Immigrants | Belgium | 41.5 /100 | #181 | Average 3.0% |
| Immigrants | Italy | 41.1 /100 | #182 | Average 3.0% |
| Bulgarians | 39.7 /100 | #183 | Fair 3.0% |