Immigrants from Northern Africa vs Liberian Hearing Disability
COMPARE
Immigrants from Northern Africa
Liberian
Hearing Disability
Hearing Disability Comparison
Immigrants from Northern Africa
Liberians
2.8%
HEARING DISABILITY
96.9/ 100
METRIC RATING
85th/ 347
METRIC RANK
2.8%
HEARING DISABILITY
89.0/ 100
METRIC RATING
122nd/ 347
METRIC RANK
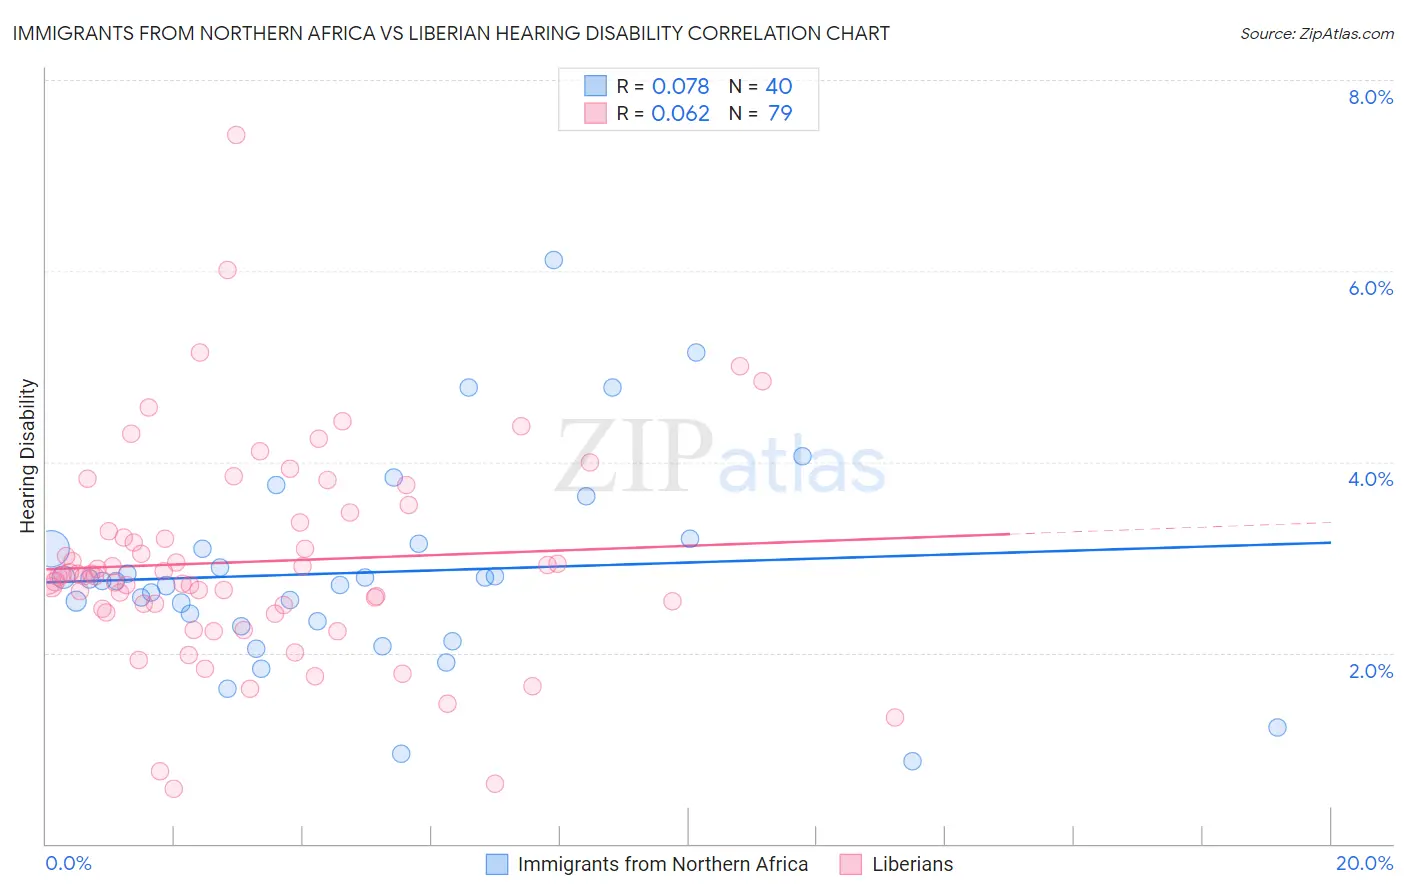
Immigrants from Northern Africa vs Liberian Hearing Disability Correlation Chart
The statistical analysis conducted on geographies consisting of 321,108,850 people shows a slight positive correlation between the proportion of Immigrants from Northern Africa and percentage of population with hearing disability in the United States with a correlation coefficient (R) of 0.078 and weighted average of 2.8%. Similarly, the statistical analysis conducted on geographies consisting of 118,050,307 people shows a slight positive correlation between the proportion of Liberians and percentage of population with hearing disability in the United States with a correlation coefficient (R) of 0.062 and weighted average of 2.8%, a difference of 3.4%.
Hearing Disability Correlation Summary
| Measurement | Immigrants from Northern Africa | Liberian |
| Minimum | 0.86% | 0.58% |
| Maximum | 6.1% | 7.4% |
| Range | 5.3% | 6.9% |
| Mean | 2.8% | 3.0% |
| Median | 2.8% | 2.8% |
| Interquartile 25% (IQ1) | 2.3% | 2.5% |
| Interquartile 75% (IQ3) | 3.1% | 3.4% |
| Interquartile Range (IQR) | 0.81% | 0.91% |
| Standard Deviation (Sample) | 1.1% | 1.1% |
| Standard Deviation (Population) | 1.1% | 1.1% |
Similar Demographics by Hearing Disability
Demographics Similar to Immigrants from Northern Africa by Hearing Disability
In terms of hearing disability, the demographic groups most similar to Immigrants from Northern Africa are Immigrants from Iran (2.8%, a difference of 0.020%), Immigrants from Argentina (2.8%, a difference of 0.070%), Somali (2.8%, a difference of 0.13%), Immigrants from Turkey (2.8%, a difference of 0.17%), and Belizean (2.8%, a difference of 0.20%).
| Demographics | Rating | Rank | Hearing Disability |
| Mongolians | 97.4 /100 | #78 | Exceptional 2.7% |
| Colombians | 97.4 /100 | #79 | Exceptional 2.7% |
| Immigrants | Asia | 97.2 /100 | #80 | Exceptional 2.7% |
| Immigrants | Uruguay | 97.2 /100 | #81 | Exceptional 2.7% |
| Immigrants | Armenia | 97.2 /100 | #82 | Exceptional 2.7% |
| Immigrants | Cuba | 97.2 /100 | #83 | Exceptional 2.7% |
| Immigrants | Argentina | 97.0 /100 | #84 | Exceptional 2.8% |
| Immigrants | Northern Africa | 96.9 /100 | #85 | Exceptional 2.8% |
| Immigrants | Iran | 96.8 /100 | #86 | Exceptional 2.8% |
| Somalis | 96.7 /100 | #87 | Exceptional 2.8% |
| Immigrants | Turkey | 96.7 /100 | #88 | Exceptional 2.8% |
| Belizeans | 96.6 /100 | #89 | Exceptional 2.8% |
| Immigrants | Morocco | 96.6 /100 | #90 | Exceptional 2.8% |
| Immigrants | Middle Africa | 96.5 /100 | #91 | Exceptional 2.8% |
| Iranians | 96.4 /100 | #92 | Exceptional 2.8% |
Demographics Similar to Liberians by Hearing Disability
In terms of hearing disability, the demographic groups most similar to Liberians are Cuban (2.8%, a difference of 0.090%), Immigrants from Zaire (2.9%, a difference of 0.090%), Bahamian (2.9%, a difference of 0.10%), Jordanian (2.8%, a difference of 0.13%), and Immigrants from Albania (2.9%, a difference of 0.13%).
| Demographics | Rating | Rank | Hearing Disability |
| Immigrants | Latin America | 90.5 /100 | #115 | Exceptional 2.8% |
| Immigrants | Immigrants | 90.3 /100 | #116 | Exceptional 2.8% |
| Immigrants | Liberia | 90.0 /100 | #117 | Excellent 2.8% |
| Zimbabweans | 89.9 /100 | #118 | Excellent 2.8% |
| Kenyans | 89.8 /100 | #119 | Excellent 2.8% |
| Jordanians | 89.5 /100 | #120 | Excellent 2.8% |
| Cubans | 89.4 /100 | #121 | Excellent 2.8% |
| Liberians | 89.0 /100 | #122 | Excellent 2.8% |
| Immigrants | Zaire | 88.6 /100 | #123 | Excellent 2.9% |
| Bahamians | 88.6 /100 | #124 | Excellent 2.9% |
| Immigrants | Albania | 88.5 /100 | #125 | Excellent 2.9% |
| Immigrants | Sudan | 87.8 /100 | #126 | Excellent 2.9% |
| South American Indians | 86.9 /100 | #127 | Excellent 2.9% |
| Immigrants | Western Asia | 86.9 /100 | #128 | Excellent 2.9% |
| Immigrants | Uganda | 86.6 /100 | #129 | Excellent 2.9% |