Immigrants from Northern Africa vs Slavic Hearing Disability
COMPARE
Immigrants from Northern Africa
Slavic
Hearing Disability
Hearing Disability Comparison
Immigrants from Northern Africa
Slavs
2.8%
HEARING DISABILITY
96.9/ 100
METRIC RATING
85th/ 347
METRIC RANK
3.4%
HEARING DISABILITY
0.2/ 100
METRIC RATING
254th/ 347
METRIC RANK
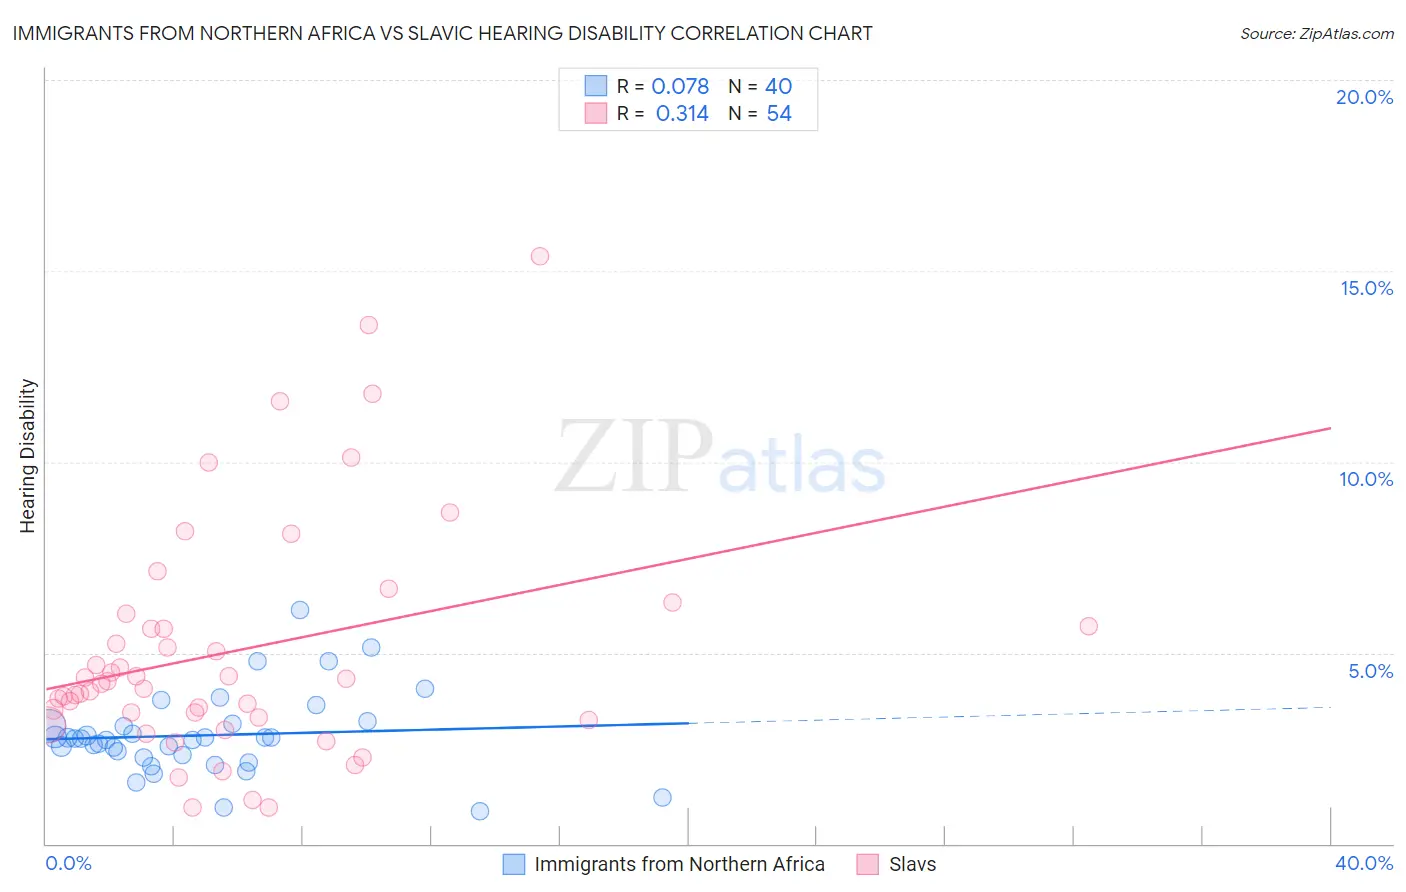
Immigrants from Northern Africa vs Slavic Hearing Disability Correlation Chart
The statistical analysis conducted on geographies consisting of 321,108,850 people shows a slight positive correlation between the proportion of Immigrants from Northern Africa and percentage of population with hearing disability in the United States with a correlation coefficient (R) of 0.078 and weighted average of 2.8%. Similarly, the statistical analysis conducted on geographies consisting of 270,835,227 people shows a mild positive correlation between the proportion of Slavs and percentage of population with hearing disability in the United States with a correlation coefficient (R) of 0.314 and weighted average of 3.4%, a difference of 24.2%.
Hearing Disability Correlation Summary
| Measurement | Immigrants from Northern Africa | Slavic |
| Minimum | 0.86% | 0.96% |
| Maximum | 6.1% | 15.4% |
| Range | 5.3% | 14.4% |
| Mean | 2.8% | 5.0% |
| Median | 2.8% | 4.2% |
| Interquartile 25% (IQ1) | 2.3% | 3.3% |
| Interquartile 75% (IQ3) | 3.1% | 5.7% |
| Interquartile Range (IQR) | 0.81% | 2.4% |
| Standard Deviation (Sample) | 1.1% | 3.1% |
| Standard Deviation (Population) | 1.1% | 3.1% |
Similar Demographics by Hearing Disability
Demographics Similar to Immigrants from Northern Africa by Hearing Disability
In terms of hearing disability, the demographic groups most similar to Immigrants from Northern Africa are Immigrants from Iran (2.8%, a difference of 0.020%), Immigrants from Argentina (2.8%, a difference of 0.070%), Somali (2.8%, a difference of 0.13%), Immigrants from Turkey (2.8%, a difference of 0.17%), and Belizean (2.8%, a difference of 0.20%).
| Demographics | Rating | Rank | Hearing Disability |
| Mongolians | 97.4 /100 | #78 | Exceptional 2.7% |
| Colombians | 97.4 /100 | #79 | Exceptional 2.7% |
| Immigrants | Asia | 97.2 /100 | #80 | Exceptional 2.7% |
| Immigrants | Uruguay | 97.2 /100 | #81 | Exceptional 2.7% |
| Immigrants | Armenia | 97.2 /100 | #82 | Exceptional 2.7% |
| Immigrants | Cuba | 97.2 /100 | #83 | Exceptional 2.7% |
| Immigrants | Argentina | 97.0 /100 | #84 | Exceptional 2.8% |
| Immigrants | Northern Africa | 96.9 /100 | #85 | Exceptional 2.8% |
| Immigrants | Iran | 96.8 /100 | #86 | Exceptional 2.8% |
| Somalis | 96.7 /100 | #87 | Exceptional 2.8% |
| Immigrants | Turkey | 96.7 /100 | #88 | Exceptional 2.8% |
| Belizeans | 96.6 /100 | #89 | Exceptional 2.8% |
| Immigrants | Morocco | 96.6 /100 | #90 | Exceptional 2.8% |
| Immigrants | Middle Africa | 96.5 /100 | #91 | Exceptional 2.8% |
| Iranians | 96.4 /100 | #92 | Exceptional 2.8% |
Demographics Similar to Slavs by Hearing Disability
In terms of hearing disability, the demographic groups most similar to Slavs are Polish (3.4%, a difference of 0.23%), Hmong (3.4%, a difference of 0.27%), Carpatho Rusyn (3.4%, a difference of 0.42%), Yaqui (3.4%, a difference of 0.73%), and Northern European (3.4%, a difference of 0.79%).
| Demographics | Rating | Rank | Hearing Disability |
| Lithuanians | 0.6 /100 | #247 | Tragic 3.4% |
| Austrians | 0.6 /100 | #248 | Tragic 3.4% |
| Italians | 0.4 /100 | #249 | Tragic 3.4% |
| Yuman | 0.4 /100 | #250 | Tragic 3.4% |
| Hungarians | 0.4 /100 | #251 | Tragic 3.4% |
| Croatians | 0.4 /100 | #252 | Tragic 3.4% |
| Carpatho Rusyns | 0.3 /100 | #253 | Tragic 3.4% |
| Slavs | 0.2 /100 | #254 | Tragic 3.4% |
| Poles | 0.2 /100 | #255 | Tragic 3.4% |
| Hmong | 0.2 /100 | #256 | Tragic 3.4% |
| Yaqui | 0.2 /100 | #257 | Tragic 3.4% |
| Northern Europeans | 0.2 /100 | #258 | Tragic 3.4% |
| Slovenes | 0.1 /100 | #259 | Tragic 3.5% |
| Portuguese | 0.1 /100 | #260 | Tragic 3.5% |
| Hawaiians | 0.1 /100 | #261 | Tragic 3.5% |