Immigrants from Northern Europe vs Immigrants from Belize Disability Age 5 to 17
COMPARE
Immigrants from Northern Europe
Immigrants from Belize
Disability Age 5 to 17
Disability Age 5 to 17 Comparison
Immigrants from Northern Europe
Immigrants from Belize
5.3%
DISABILITY AGE 5 TO 17
97.8/ 100
METRIC RATING
114th/ 347
METRIC RANK
5.4%
DISABILITY AGE 5 TO 17
91.7/ 100
METRIC RATING
135th/ 347
METRIC RANK
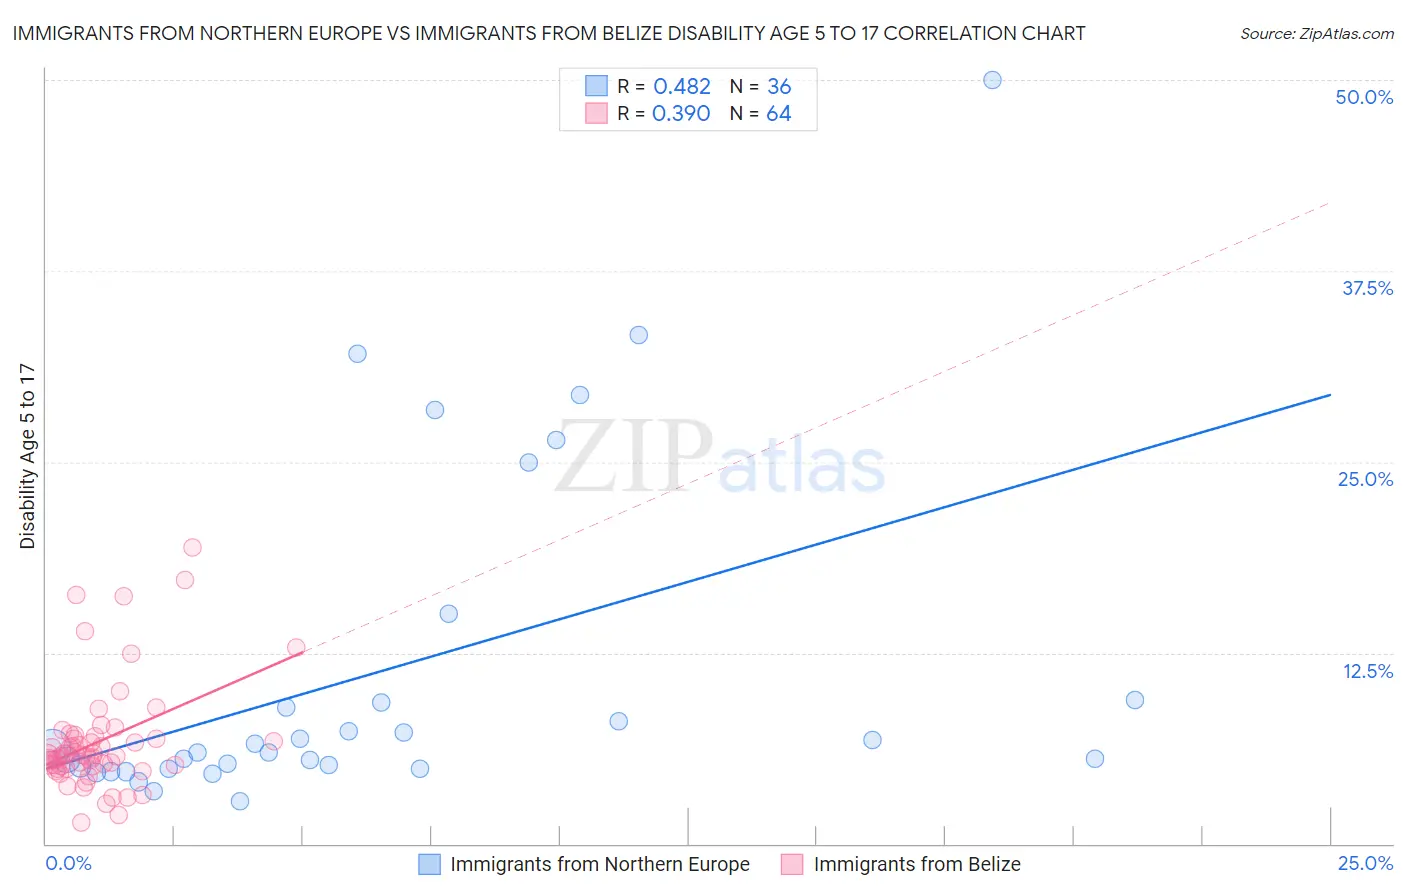
Immigrants from Northern Europe vs Immigrants from Belize Disability Age 5 to 17 Correlation Chart
The statistical analysis conducted on geographies consisting of 470,776,884 people shows a moderate positive correlation between the proportion of Immigrants from Northern Europe and percentage of population with a disability between the ages 5 and 17 in the United States with a correlation coefficient (R) of 0.482 and weighted average of 5.3%. Similarly, the statistical analysis conducted on geographies consisting of 129,905,641 people shows a mild positive correlation between the proportion of Immigrants from Belize and percentage of population with a disability between the ages 5 and 17 in the United States with a correlation coefficient (R) of 0.390 and weighted average of 5.4%, a difference of 1.8%.
Disability Age 5 to 17 Correlation Summary
| Measurement | Immigrants from Northern Europe | Immigrants from Belize |
| Minimum | 2.8% | 1.4% |
| Maximum | 50.0% | 19.4% |
| Range | 47.2% | 17.9% |
| Mean | 11.2% | 6.7% |
| Median | 6.1% | 5.8% |
| Interquartile 25% (IQ1) | 5.0% | 5.1% |
| Interquartile 75% (IQ3) | 9.3% | 7.0% |
| Interquartile Range (IQR) | 4.4% | 1.9% |
| Standard Deviation (Sample) | 11.2% | 3.5% |
| Standard Deviation (Population) | 11.0% | 3.5% |
Similar Demographics by Disability Age 5 to 17
Demographics Similar to Immigrants from Northern Europe by Disability Age 5 to 17
In terms of disability age 5 to 17, the demographic groups most similar to Immigrants from Northern Europe are Cuban (5.3%, a difference of 0.010%), Aleut (5.3%, a difference of 0.020%), Immigrants from Latvia (5.3%, a difference of 0.070%), Cypriot (5.3%, a difference of 0.080%), and Ethiopian (5.3%, a difference of 0.090%).
| Demographics | Rating | Rank | Disability Age 5 to 17 |
| Russians | 98.2 /100 | #107 | Exceptional 5.3% |
| Immigrants | South Africa | 98.1 /100 | #108 | Exceptional 5.3% |
| Immigrants | Northern Africa | 98.1 /100 | #109 | Exceptional 5.3% |
| Immigrants | Eritrea | 98.0 /100 | #110 | Exceptional 5.3% |
| Ethiopians | 97.9 /100 | #111 | Exceptional 5.3% |
| Immigrants | Latvia | 97.9 /100 | #112 | Exceptional 5.3% |
| Aleuts | 97.8 /100 | #113 | Exceptional 5.3% |
| Immigrants | Northern Europe | 97.8 /100 | #114 | Exceptional 5.3% |
| Cubans | 97.8 /100 | #115 | Exceptional 5.3% |
| Cypriots | 97.7 /100 | #116 | Exceptional 5.3% |
| Immigrants | Afghanistan | 97.4 /100 | #117 | Exceptional 5.3% |
| South Americans | 97.1 /100 | #118 | Exceptional 5.4% |
| Immigrants | South America | 97.1 /100 | #119 | Exceptional 5.4% |
| Immigrants | Immigrants | 97.0 /100 | #120 | Exceptional 5.4% |
| Maltese | 96.0 /100 | #121 | Exceptional 5.4% |
Demographics Similar to Immigrants from Belize by Disability Age 5 to 17
In terms of disability age 5 to 17, the demographic groups most similar to Immigrants from Belize are Immigrants from Denmark (5.4%, a difference of 0.050%), Yuman (5.4%, a difference of 0.10%), Navajo (5.4%, a difference of 0.13%), Immigrants from Oceania (5.4%, a difference of 0.14%), and Belizean (5.4%, a difference of 0.14%).
| Demographics | Rating | Rank | Disability Age 5 to 17 |
| Immigrants | Venezuela | 94.5 /100 | #128 | Exceptional 5.4% |
| Romanians | 94.1 /100 | #129 | Exceptional 5.4% |
| Immigrants | Bulgaria | 94.0 /100 | #130 | Exceptional 5.4% |
| Arabs | 92.9 /100 | #131 | Exceptional 5.4% |
| Immigrants | Colombia | 92.9 /100 | #132 | Exceptional 5.4% |
| Venezuelans | 92.7 /100 | #133 | Exceptional 5.4% |
| Yuman | 92.3 /100 | #134 | Exceptional 5.4% |
| Immigrants | Belize | 91.7 /100 | #135 | Exceptional 5.4% |
| Immigrants | Denmark | 91.4 /100 | #136 | Exceptional 5.4% |
| Navajo | 90.9 /100 | #137 | Exceptional 5.4% |
| Immigrants | Oceania | 90.8 /100 | #138 | Exceptional 5.4% |
| Belizeans | 90.8 /100 | #139 | Exceptional 5.4% |
| Immigrants | Netherlands | 90.5 /100 | #140 | Exceptional 5.4% |
| South American Indians | 89.3 /100 | #141 | Excellent 5.5% |
| Colombians | 88.0 /100 | #142 | Excellent 5.5% |