Immigrants from North America vs Immigrants from Netherlands Self-Care Disability
COMPARE
Immigrants from North America
Immigrants from Netherlands
Self-Care Disability
Self-Care Disability Comparison
Immigrants from North America
Immigrants from Netherlands
2.4%
SELF-CARE DISABILITY
90.2/ 100
METRIC RATING
124th/ 347
METRIC RANK
2.3%
SELF-CARE DISABILITY
99.1/ 100
METRIC RATING
75th/ 347
METRIC RANK
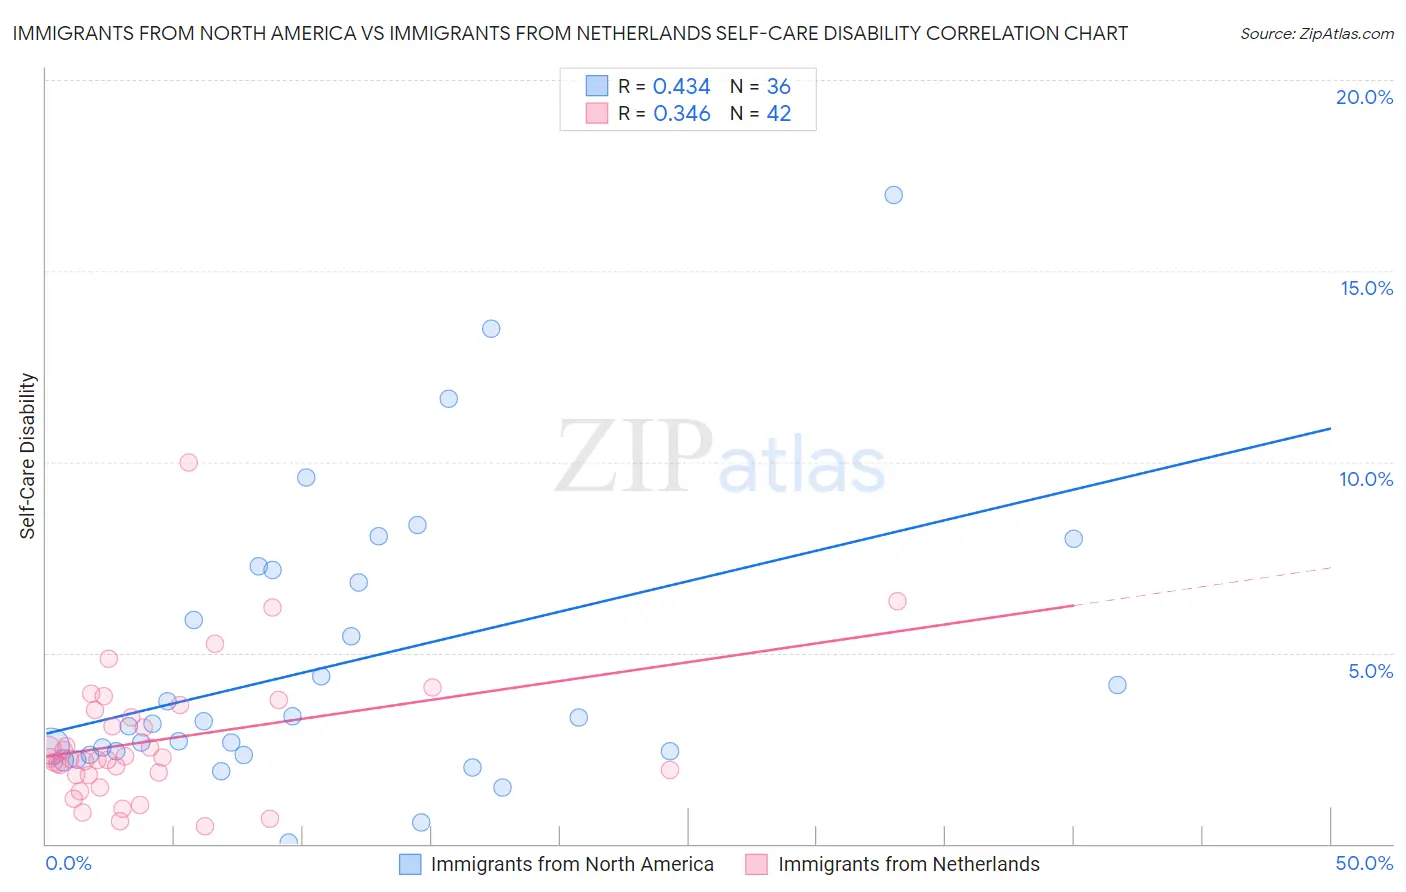
Immigrants from North America vs Immigrants from Netherlands Self-Care Disability Correlation Chart
The statistical analysis conducted on geographies consisting of 461,724,382 people shows a moderate positive correlation between the proportion of Immigrants from North America and percentage of population with self-care disability in the United States with a correlation coefficient (R) of 0.434 and weighted average of 2.4%. Similarly, the statistical analysis conducted on geographies consisting of 237,728,071 people shows a mild positive correlation between the proportion of Immigrants from Netherlands and percentage of population with self-care disability in the United States with a correlation coefficient (R) of 0.346 and weighted average of 2.3%, a difference of 3.1%.
Self-Care Disability Correlation Summary
| Measurement | Immigrants from North America | Immigrants from Netherlands |
| Minimum | 0.045% | 0.45% |
| Maximum | 17.0% | 10.0% |
| Range | 17.0% | 9.5% |
| Mean | 4.7% | 2.7% |
| Median | 3.2% | 2.2% |
| Interquartile 25% (IQ1) | 2.4% | 1.8% |
| Interquartile 75% (IQ3) | 7.0% | 3.5% |
| Interquartile Range (IQR) | 4.6% | 1.7% |
| Standard Deviation (Sample) | 3.7% | 1.8% |
| Standard Deviation (Population) | 3.7% | 1.8% |
Similar Demographics by Self-Care Disability
Demographics Similar to Immigrants from North America by Self-Care Disability
In terms of self-care disability, the demographic groups most similar to Immigrants from North America are Immigrants from Morocco (2.4%, a difference of 0.0%), Immigrants from Nigeria (2.4%, a difference of 0.010%), Hmong (2.4%, a difference of 0.040%), Colombian (2.4%, a difference of 0.070%), and Immigrants from Hungary (2.4%, a difference of 0.080%).
| Demographics | Rating | Rank | Self-Care Disability |
| Taiwanese | 92.5 /100 | #117 | Exceptional 2.4% |
| Immigrants | Canada | 92.0 /100 | #118 | Exceptional 2.4% |
| Immigrants | Sierra Leone | 91.8 /100 | #119 | Exceptional 2.4% |
| Uruguayans | 91.5 /100 | #120 | Exceptional 2.4% |
| Peruvians | 91.3 /100 | #121 | Exceptional 2.4% |
| Belgians | 90.9 /100 | #122 | Exceptional 2.4% |
| Immigrants | Nigeria | 90.3 /100 | #123 | Exceptional 2.4% |
| Immigrants | North America | 90.2 /100 | #124 | Exceptional 2.4% |
| Immigrants | Morocco | 90.2 /100 | #124 | Exceptional 2.4% |
| Hmong | 89.9 /100 | #126 | Excellent 2.4% |
| Colombians | 89.7 /100 | #127 | Excellent 2.4% |
| Immigrants | Hungary | 89.6 /100 | #128 | Excellent 2.4% |
| Immigrants | Romania | 89.3 /100 | #129 | Excellent 2.4% |
| Immigrants | Austria | 89.0 /100 | #130 | Excellent 2.4% |
| Poles | 88.9 /100 | #131 | Excellent 2.4% |
Demographics Similar to Immigrants from Netherlands by Self-Care Disability
In terms of self-care disability, the demographic groups most similar to Immigrants from Netherlands are Immigrants from China (2.3%, a difference of 0.010%), Immigrants from Switzerland (2.3%, a difference of 0.040%), Immigrants from Middle Africa (2.3%, a difference of 0.090%), Immigrants from Ireland (2.3%, a difference of 0.090%), and Immigrants from Egypt (2.3%, a difference of 0.10%).
| Demographics | Rating | Rank | Self-Care Disability |
| Immigrants | Zaire | 99.2 /100 | #68 | Exceptional 2.3% |
| Immigrants | Norway | 99.2 /100 | #69 | Exceptional 2.3% |
| Immigrants | Northern Europe | 99.2 /100 | #70 | Exceptional 2.3% |
| Asians | 99.2 /100 | #71 | Exceptional 2.3% |
| Eastern Europeans | 99.2 /100 | #72 | Exceptional 2.3% |
| Immigrants | Egypt | 99.1 /100 | #73 | Exceptional 2.3% |
| Immigrants | Switzerland | 99.1 /100 | #74 | Exceptional 2.3% |
| Immigrants | Netherlands | 99.1 /100 | #75 | Exceptional 2.3% |
| Immigrants | China | 99.1 /100 | #76 | Exceptional 2.3% |
| Immigrants | Middle Africa | 99.0 /100 | #77 | Exceptional 2.3% |
| Immigrants | Ireland | 99.0 /100 | #78 | Exceptional 2.3% |
| Immigrants | Kenya | 99.0 /100 | #79 | Exceptional 2.3% |
| Chileans | 98.8 /100 | #80 | Exceptional 2.3% |
| Ugandans | 98.8 /100 | #81 | Exceptional 2.3% |
| Immigrants | Denmark | 98.8 /100 | #82 | Exceptional 2.3% |