Cherokee vs Immigrants from Netherlands Self-Care Disability
COMPARE
Cherokee
Immigrants from Netherlands
Self-Care Disability
Self-Care Disability Comparison
Cherokee
Immigrants from Netherlands
2.9%
SELF-CARE DISABILITY
0.0/ 100
METRIC RATING
324th/ 347
METRIC RANK
2.3%
SELF-CARE DISABILITY
99.1/ 100
METRIC RATING
75th/ 347
METRIC RANK
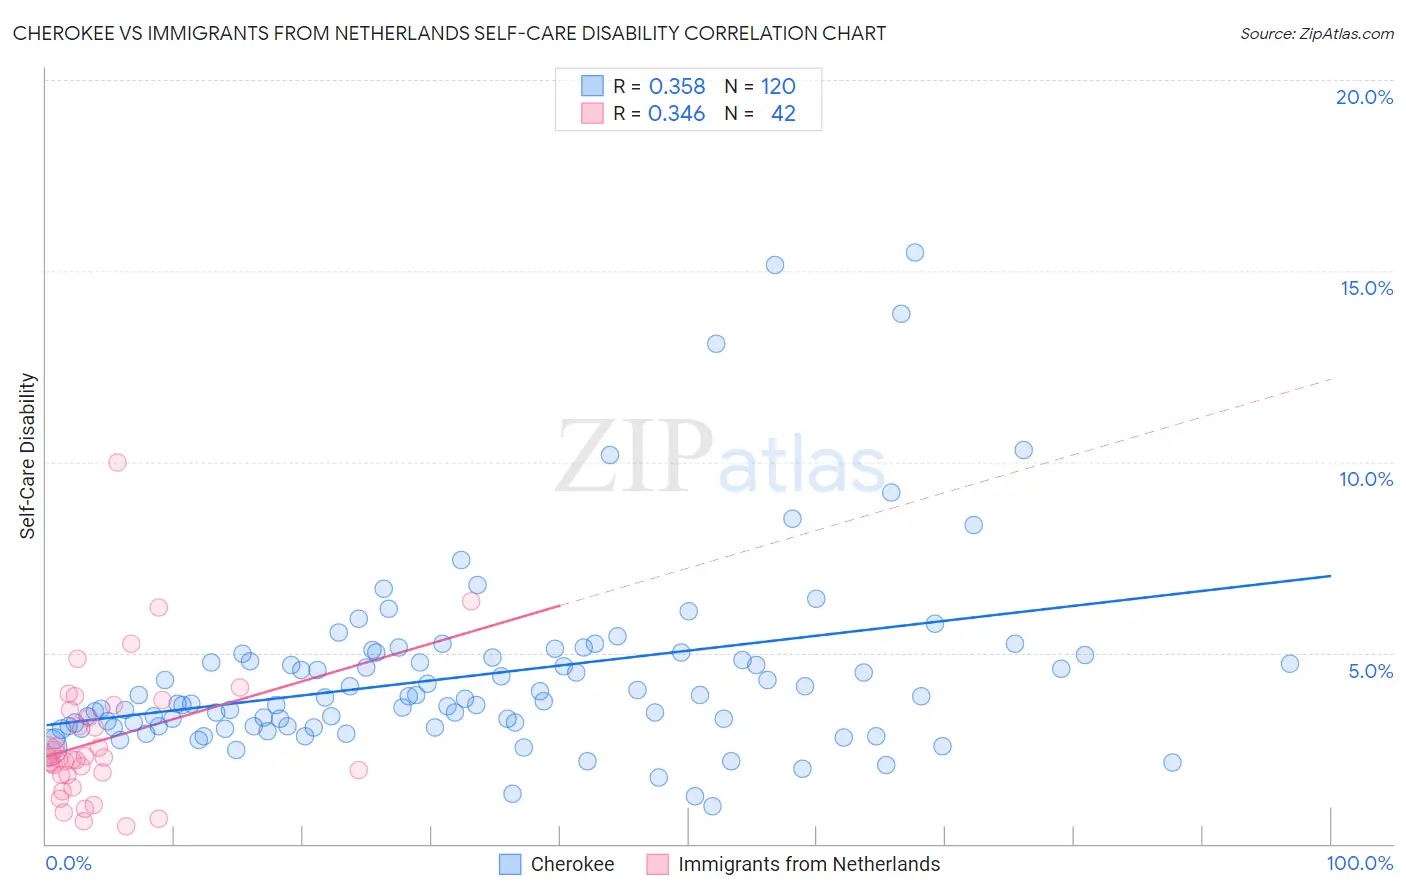
Cherokee vs Immigrants from Netherlands Self-Care Disability Correlation Chart
The statistical analysis conducted on geographies consisting of 492,732,584 people shows a mild positive correlation between the proportion of Cherokee and percentage of population with self-care disability in the United States with a correlation coefficient (R) of 0.358 and weighted average of 2.9%. Similarly, the statistical analysis conducted on geographies consisting of 237,728,071 people shows a mild positive correlation between the proportion of Immigrants from Netherlands and percentage of population with self-care disability in the United States with a correlation coefficient (R) of 0.346 and weighted average of 2.3%, a difference of 23.6%.
Self-Care Disability Correlation Summary
| Measurement | Cherokee | Immigrants from Netherlands |
| Minimum | 0.97% | 0.45% |
| Maximum | 15.5% | 10.0% |
| Range | 14.5% | 9.5% |
| Mean | 4.4% | 2.7% |
| Median | 3.8% | 2.2% |
| Interquartile 25% (IQ1) | 3.1% | 1.8% |
| Interquartile 75% (IQ3) | 4.9% | 3.5% |
| Interquartile Range (IQR) | 1.8% | 1.7% |
| Standard Deviation (Sample) | 2.5% | 1.8% |
| Standard Deviation (Population) | 2.5% | 1.8% |
Similar Demographics by Self-Care Disability
Demographics Similar to Cherokee by Self-Care Disability
In terms of self-care disability, the demographic groups most similar to Cherokee are Seminole (2.9%, a difference of 0.10%), Comanche (2.9%, a difference of 0.22%), Immigrants from Uzbekistan (2.9%, a difference of 0.53%), Navajo (2.9%, a difference of 0.55%), and Chickasaw (2.9%, a difference of 0.70%).
| Demographics | Rating | Rank | Self-Care Disability |
| Immigrants | Dominica | 0.0 /100 | #317 | Tragic 2.8% |
| Assyrians/Chaldeans/Syriacs | 0.0 /100 | #318 | Tragic 2.8% |
| Spanish American Indians | 0.0 /100 | #319 | Tragic 2.9% |
| Chickasaw | 0.0 /100 | #320 | Tragic 2.9% |
| Navajo | 0.0 /100 | #321 | Tragic 2.9% |
| Comanche | 0.0 /100 | #322 | Tragic 2.9% |
| Seminole | 0.0 /100 | #323 | Tragic 2.9% |
| Cherokee | 0.0 /100 | #324 | Tragic 2.9% |
| Immigrants | Uzbekistan | 0.0 /100 | #325 | Tragic 2.9% |
| Paiute | 0.0 /100 | #326 | Tragic 2.9% |
| Blacks/African Americans | 0.0 /100 | #327 | Tragic 2.9% |
| Hopi | 0.0 /100 | #328 | Tragic 2.9% |
| Cajuns | 0.0 /100 | #329 | Tragic 2.9% |
| Nepalese | 0.0 /100 | #330 | Tragic 3.0% |
| Lumbee | 0.0 /100 | #331 | Tragic 3.0% |
Demographics Similar to Immigrants from Netherlands by Self-Care Disability
In terms of self-care disability, the demographic groups most similar to Immigrants from Netherlands are Immigrants from China (2.3%, a difference of 0.010%), Immigrants from Switzerland (2.3%, a difference of 0.040%), Immigrants from Middle Africa (2.3%, a difference of 0.090%), Immigrants from Ireland (2.3%, a difference of 0.090%), and Immigrants from Egypt (2.3%, a difference of 0.10%).
| Demographics | Rating | Rank | Self-Care Disability |
| Immigrants | Zaire | 99.2 /100 | #68 | Exceptional 2.3% |
| Immigrants | Norway | 99.2 /100 | #69 | Exceptional 2.3% |
| Immigrants | Northern Europe | 99.2 /100 | #70 | Exceptional 2.3% |
| Asians | 99.2 /100 | #71 | Exceptional 2.3% |
| Eastern Europeans | 99.2 /100 | #72 | Exceptional 2.3% |
| Immigrants | Egypt | 99.1 /100 | #73 | Exceptional 2.3% |
| Immigrants | Switzerland | 99.1 /100 | #74 | Exceptional 2.3% |
| Immigrants | Netherlands | 99.1 /100 | #75 | Exceptional 2.3% |
| Immigrants | China | 99.1 /100 | #76 | Exceptional 2.3% |
| Immigrants | Middle Africa | 99.0 /100 | #77 | Exceptional 2.3% |
| Immigrants | Ireland | 99.0 /100 | #78 | Exceptional 2.3% |
| Immigrants | Kenya | 99.0 /100 | #79 | Exceptional 2.3% |
| Chileans | 98.8 /100 | #80 | Exceptional 2.3% |
| Ugandans | 98.8 /100 | #81 | Exceptional 2.3% |
| Immigrants | Denmark | 98.8 /100 | #82 | Exceptional 2.3% |