Immigrants from North America vs Immigrants from Netherlands Unemployment Among Ages 30 to 34 years
COMPARE
Immigrants from North America
Immigrants from Netherlands
Unemployment Among Ages 30 to 34 years
Unemployment Among Ages 30 to 34 years Comparison
Immigrants from North America
Immigrants from Netherlands
5.4%
UNEMPLOYMENT AMONG AGES 30 TO 34 YEARS
72.2/ 100
METRIC RATING
140th/ 347
METRIC RANK
5.3%
UNEMPLOYMENT AMONG AGES 30 TO 34 YEARS
81.8/ 100
METRIC RATING
122nd/ 347
METRIC RANK
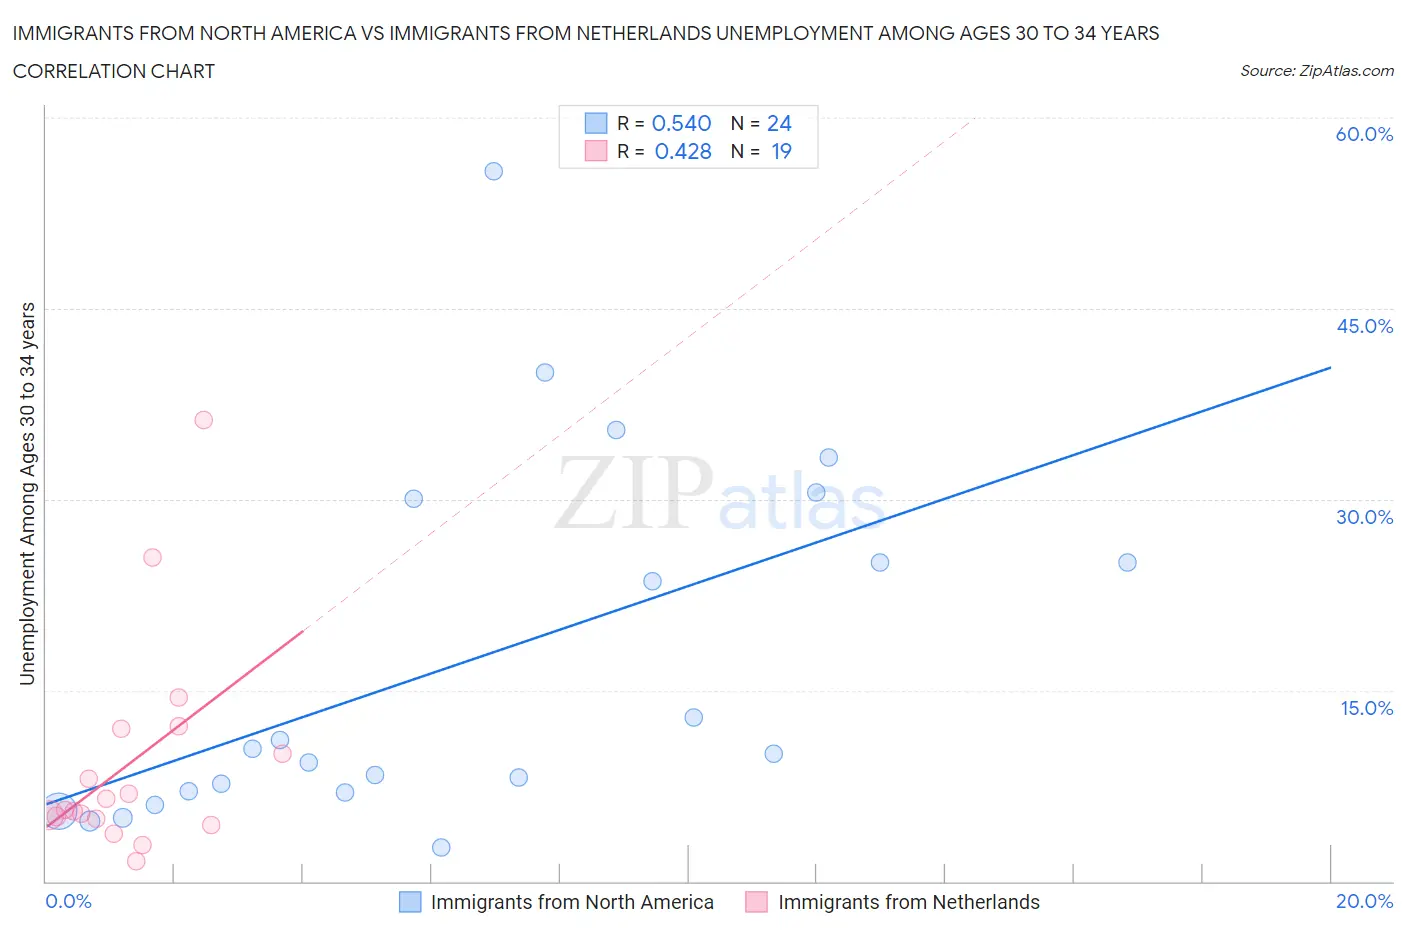
Immigrants from North America vs Immigrants from Netherlands Unemployment Among Ages 30 to 34 years Correlation Chart
The statistical analysis conducted on geographies consisting of 425,298,151 people shows a substantial positive correlation between the proportion of Immigrants from North America and unemployment rate among population between the ages 30 and 34 in the United States with a correlation coefficient (R) of 0.540 and weighted average of 5.4%. Similarly, the statistical analysis conducted on geographies consisting of 227,644,574 people shows a moderate positive correlation between the proportion of Immigrants from Netherlands and unemployment rate among population between the ages 30 and 34 in the United States with a correlation coefficient (R) of 0.428 and weighted average of 5.3%, a difference of 0.98%.
Unemployment Among Ages 30 to 34 years Correlation Summary
| Measurement | Immigrants from North America | Immigrants from Netherlands |
| Minimum | 2.7% | 1.6% |
| Maximum | 55.8% | 36.2% |
| Range | 53.1% | 34.6% |
| Mean | 17.3% | 9.3% |
| Median | 10.2% | 5.6% |
| Interquartile 25% (IQ1) | 7.0% | 4.9% |
| Interquartile 75% (IQ3) | 27.5% | 12.0% |
| Interquartile Range (IQR) | 20.5% | 7.1% |
| Standard Deviation (Sample) | 14.1% | 8.5% |
| Standard Deviation (Population) | 13.8% | 8.3% |
Demographics Similar to Immigrants from North America and Immigrants from Netherlands by Unemployment Among Ages 30 to 34 years
In terms of unemployment among ages 30 to 34 years, the demographic groups most similar to Immigrants from North America are Lithuanian (5.4%, a difference of 0.020%), Immigrants from Europe (5.4%, a difference of 0.020%), Serbian (5.4%, a difference of 0.060%), Immigrants from Canada (5.4%, a difference of 0.21%), and Pakistani (5.4%, a difference of 0.22%). Similarly, the demographic groups most similar to Immigrants from Netherlands are Romanian (5.3%, a difference of 0.050%), Immigrants from Italy (5.3%, a difference of 0.090%), Immigrants from Brazil (5.3%, a difference of 0.12%), Greek (5.3%, a difference of 0.17%), and Immigrants from Sri Lanka (5.3%, a difference of 0.19%).
| Demographics | Rating | Rank | Unemployment Among Ages 30 to 34 years |
| Romanians | 82.3 /100 | #121 | Excellent 5.3% |
| Immigrants | Netherlands | 81.8 /100 | #122 | Excellent 5.3% |
| Immigrants | Italy | 81.1 /100 | #123 | Excellent 5.3% |
| Immigrants | Brazil | 80.8 /100 | #124 | Excellent 5.3% |
| Greeks | 80.4 /100 | #125 | Excellent 5.3% |
| Immigrants | Sri Lanka | 80.2 /100 | #126 | Excellent 5.3% |
| Taiwanese | 79.4 /100 | #127 | Good 5.3% |
| Immigrants | Uruguay | 79.3 /100 | #128 | Good 5.3% |
| Poles | 78.8 /100 | #129 | Good 5.3% |
| Germans | 77.8 /100 | #130 | Good 5.3% |
| Immigrants | Eastern Europe | 77.4 /100 | #131 | Good 5.3% |
| Carpatho Rusyns | 77.3 /100 | #132 | Good 5.3% |
| Immigrants | Northern Europe | 77.3 /100 | #133 | Good 5.3% |
| Bangladeshis | 76.6 /100 | #134 | Good 5.3% |
| Palestinians | 75.1 /100 | #135 | Good 5.4% |
| Pakistanis | 74.6 /100 | #136 | Good 5.4% |
| Immigrants | Canada | 74.6 /100 | #137 | Good 5.4% |
| Serbians | 72.9 /100 | #138 | Good 5.4% |
| Lithuanians | 72.4 /100 | #139 | Good 5.4% |
| Immigrants | North America | 72.2 /100 | #140 | Good 5.4% |
| Immigrants | Europe | 72.1 /100 | #141 | Good 5.4% |