Immigrants from North America vs Immigrants from Netherlands Master's Degree
COMPARE
Immigrants from North America
Immigrants from Netherlands
Master's Degree
Master's Degree Comparison
Immigrants from North America
Immigrants from Netherlands
17.2%
MASTER'S DEGREE
99.1/ 100
METRIC RATING
92nd/ 347
METRIC RANK
18.1%
MASTER'S DEGREE
99.9/ 100
METRIC RATING
63rd/ 347
METRIC RANK
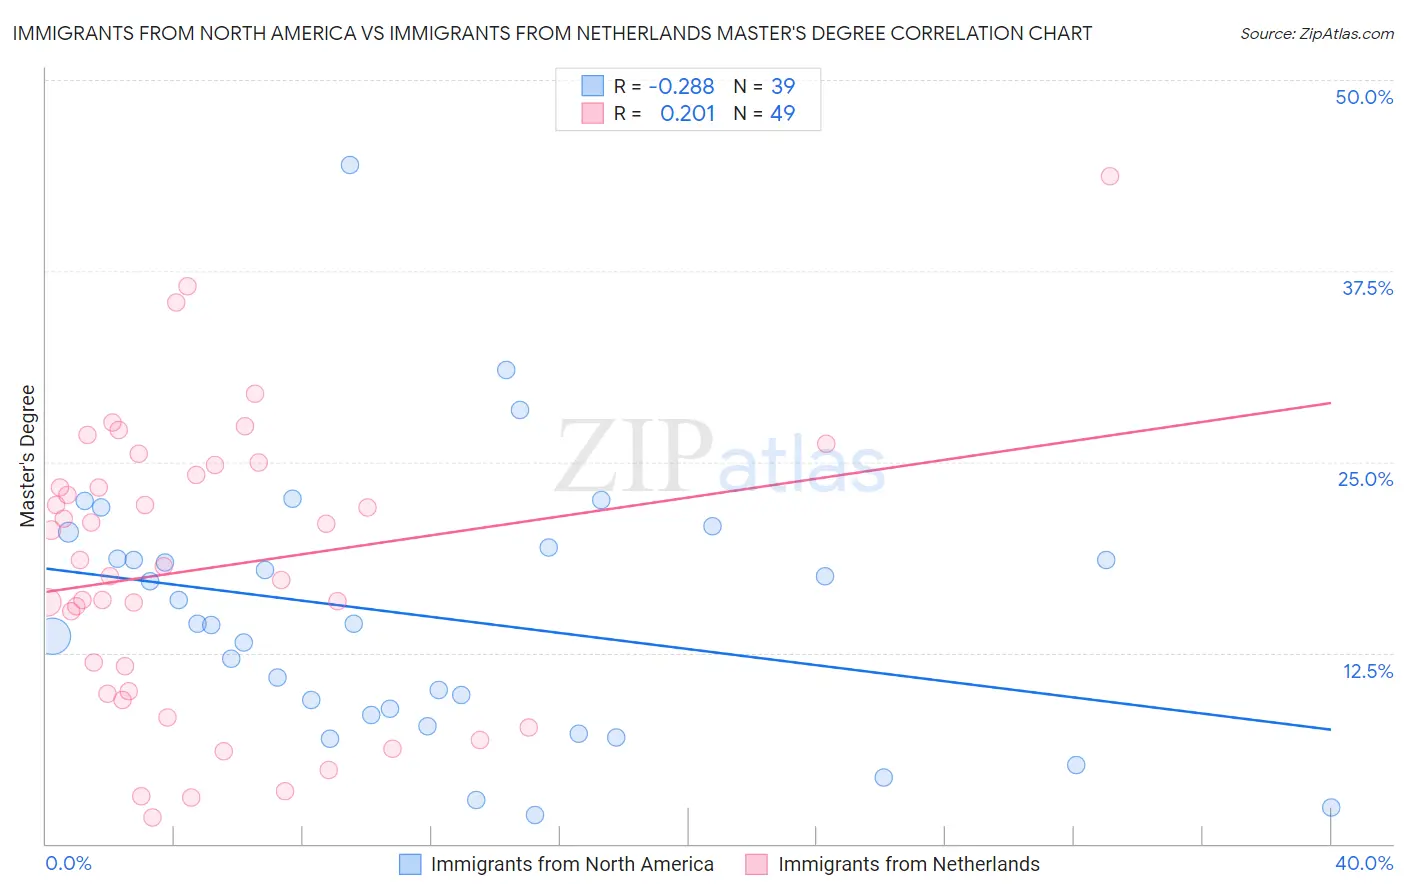
Immigrants from North America vs Immigrants from Netherlands Master's Degree Correlation Chart
The statistical analysis conducted on geographies consisting of 462,287,354 people shows a weak negative correlation between the proportion of Immigrants from North America and percentage of population with at least master's degree education in the United States with a correlation coefficient (R) of -0.288 and weighted average of 17.2%. Similarly, the statistical analysis conducted on geographies consisting of 237,861,221 people shows a weak positive correlation between the proportion of Immigrants from Netherlands and percentage of population with at least master's degree education in the United States with a correlation coefficient (R) of 0.201 and weighted average of 18.1%, a difference of 5.5%.
Master's Degree Correlation Summary
| Measurement | Immigrants from North America | Immigrants from Netherlands |
| Minimum | 1.9% | 1.7% |
| Maximum | 44.5% | 43.7% |
| Range | 42.5% | 41.9% |
| Mean | 14.9% | 18.1% |
| Median | 14.4% | 18.2% |
| Interquartile 25% (IQ1) | 8.4% | 9.9% |
| Interquartile 75% (IQ3) | 19.4% | 24.5% |
| Interquartile Range (IQR) | 11.0% | 14.6% |
| Standard Deviation (Sample) | 8.6% | 9.4% |
| Standard Deviation (Population) | 8.5% | 9.3% |
Similar Demographics by Master's Degree
Demographics Similar to Immigrants from North America by Master's Degree
In terms of master's degree, the demographic groups most similar to Immigrants from North America are Romanian (17.2%, a difference of 0.050%), Immigrants from Italy (17.2%, a difference of 0.060%), Immigrants from Egypt (17.2%, a difference of 0.12%), Bhutanese (17.2%, a difference of 0.14%), and Ugandan (17.1%, a difference of 0.19%).
| Demographics | Rating | Rank | Master's Degree |
| Immigrants | Brazil | 99.4 /100 | #85 | Exceptional 17.4% |
| Immigrants | Croatia | 99.3 /100 | #86 | Exceptional 17.3% |
| Maltese | 99.3 /100 | #87 | Exceptional 17.3% |
| Immigrants | Canada | 99.2 /100 | #88 | Exceptional 17.2% |
| Bhutanese | 99.1 /100 | #89 | Exceptional 17.2% |
| Immigrants | Egypt | 99.1 /100 | #90 | Exceptional 17.2% |
| Romanians | 99.1 /100 | #91 | Exceptional 17.2% |
| Immigrants | North America | 99.1 /100 | #92 | Exceptional 17.2% |
| Immigrants | Italy | 99.1 /100 | #93 | Exceptional 17.2% |
| Ugandans | 99.0 /100 | #94 | Exceptional 17.1% |
| Immigrants | Morocco | 98.9 /100 | #95 | Exceptional 17.1% |
| Immigrants | Northern Africa | 98.9 /100 | #96 | Exceptional 17.1% |
| Immigrants | England | 98.8 /100 | #97 | Exceptional 17.0% |
| Immigrants | Ukraine | 98.8 /100 | #98 | Exceptional 17.0% |
| Laotians | 98.8 /100 | #99 | Exceptional 17.0% |
Demographics Similar to Immigrants from Netherlands by Master's Degree
In terms of master's degree, the demographic groups most similar to Immigrants from Netherlands are South African (18.1%, a difference of 0.080%), Argentinean (18.2%, a difference of 0.36%), Immigrants from Europe (18.2%, a difference of 0.72%), Immigrants from Kazakhstan (18.0%, a difference of 0.78%), and Ethiopian (18.0%, a difference of 0.80%).
| Demographics | Rating | Rank | Master's Degree |
| Asians | 99.9 /100 | #56 | Exceptional 18.4% |
| Immigrants | Asia | 99.9 /100 | #57 | Exceptional 18.4% |
| Australians | 99.9 /100 | #58 | Exceptional 18.4% |
| Immigrants | Bulgaria | 99.9 /100 | #59 | Exceptional 18.3% |
| New Zealanders | 99.9 /100 | #60 | Exceptional 18.3% |
| Immigrants | Europe | 99.9 /100 | #61 | Exceptional 18.2% |
| Argentineans | 99.9 /100 | #62 | Exceptional 18.2% |
| Immigrants | Netherlands | 99.9 /100 | #63 | Exceptional 18.1% |
| South Africans | 99.9 /100 | #64 | Exceptional 18.1% |
| Immigrants | Kazakhstan | 99.8 /100 | #65 | Exceptional 18.0% |
| Ethiopians | 99.8 /100 | #66 | Exceptional 18.0% |
| Immigrants | Argentina | 99.8 /100 | #67 | Exceptional 18.0% |
| Immigrants | Ethiopia | 99.8 /100 | #68 | Exceptional 17.9% |
| Immigrants | Uzbekistan | 99.8 /100 | #69 | Exceptional 17.9% |
| Immigrants | Western Europe | 99.8 /100 | #70 | Exceptional 17.8% |