European vs Immigrants from England Hearing Disability
COMPARE
European
Immigrants from England
Hearing Disability
Hearing Disability Comparison
Europeans
Immigrants from England
3.5%
HEARING DISABILITY
0.1/ 100
METRIC RATING
270th/ 347
METRIC RANK
3.3%
HEARING DISABILITY
0.7/ 100
METRIC RATING
246th/ 347
METRIC RANK
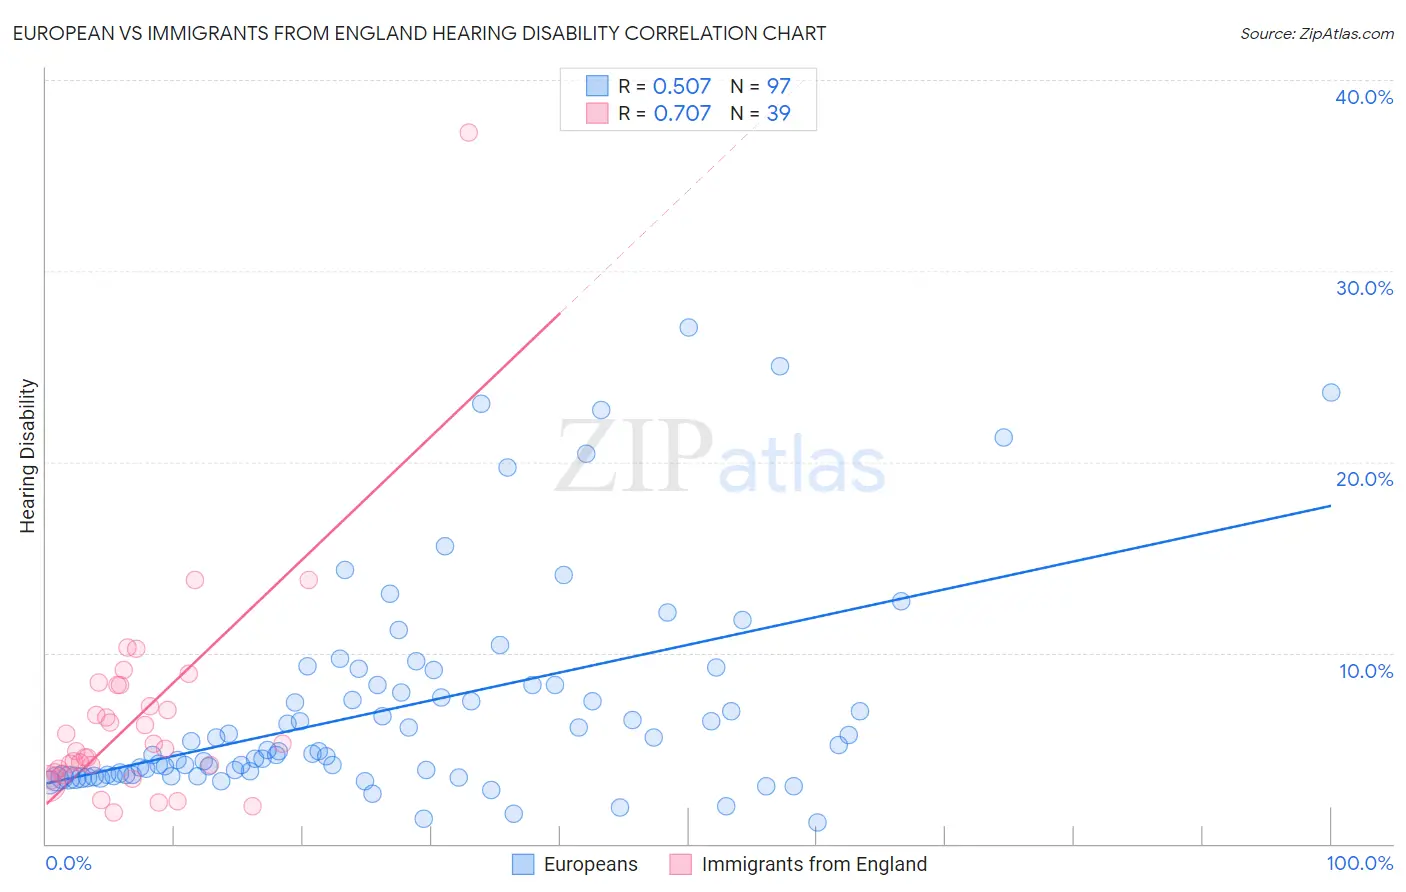
European vs Immigrants from England Hearing Disability Correlation Chart
The statistical analysis conducted on geographies consisting of 561,261,732 people shows a substantial positive correlation between the proportion of Europeans and percentage of population with hearing disability in the United States with a correlation coefficient (R) of 0.507 and weighted average of 3.5%. Similarly, the statistical analysis conducted on geographies consisting of 391,804,752 people shows a strong positive correlation between the proportion of Immigrants from England and percentage of population with hearing disability in the United States with a correlation coefficient (R) of 0.707 and weighted average of 3.3%, a difference of 5.0%.
Hearing Disability Correlation Summary
| Measurement | European | Immigrants from England |
| Minimum | 1.1% | 1.6% |
| Maximum | 27.1% | 37.3% |
| Range | 26.0% | 35.7% |
| Mean | 7.2% | 6.6% |
| Median | 4.8% | 5.0% |
| Interquartile 25% (IQ1) | 3.6% | 3.8% |
| Interquartile 75% (IQ3) | 8.3% | 8.3% |
| Interquartile Range (IQR) | 4.8% | 4.5% |
| Standard Deviation (Sample) | 5.6% | 5.9% |
| Standard Deviation (Population) | 5.6% | 5.8% |
Similar Demographics by Hearing Disability
Demographics Similar to Europeans by Hearing Disability
In terms of hearing disability, the demographic groups most similar to Europeans are Czech (3.5%, a difference of 0.26%), Ute (3.5%, a difference of 0.35%), Fijian (3.5%, a difference of 0.52%), Puerto Rican (3.5%, a difference of 0.59%), and Spaniard (3.5%, a difference of 0.65%).
| Demographics | Rating | Rank | Hearing Disability |
| Immigrants | Canada | 0.1 /100 | #263 | Tragic 3.5% |
| Immigrants | Germany | 0.1 /100 | #264 | Tragic 3.5% |
| British | 0.1 /100 | #265 | Tragic 3.5% |
| Belgians | 0.1 /100 | #266 | Tragic 3.5% |
| Canadians | 0.1 /100 | #267 | Tragic 3.5% |
| Spaniards | 0.1 /100 | #268 | Tragic 3.5% |
| Ute | 0.1 /100 | #269 | Tragic 3.5% |
| Europeans | 0.1 /100 | #270 | Tragic 3.5% |
| Czechs | 0.1 /100 | #271 | Tragic 3.5% |
| Fijians | 0.0 /100 | #272 | Tragic 3.5% |
| Puerto Ricans | 0.0 /100 | #273 | Tragic 3.5% |
| Swiss | 0.0 /100 | #274 | Tragic 3.5% |
| Czechoslovakians | 0.0 /100 | #275 | Tragic 3.6% |
| Danes | 0.0 /100 | #276 | Tragic 3.6% |
| Immigrants | Nonimmigrants | 0.0 /100 | #277 | Tragic 3.6% |
Demographics Similar to Immigrants from England by Hearing Disability
In terms of hearing disability, the demographic groups most similar to Immigrants from England are Lithuanian (3.4%, a difference of 0.20%), Immigrants from Scotland (3.3%, a difference of 0.28%), Austrian (3.4%, a difference of 0.42%), Assyrian/Chaldean/Syriac (3.3%, a difference of 0.62%), and Immigrants from Western Europe (3.3%, a difference of 0.69%).
| Demographics | Rating | Rank | Hearing Disability |
| Nepalese | 1.2 /100 | #239 | Tragic 3.3% |
| Immigrants | Netherlands | 1.1 /100 | #240 | Tragic 3.3% |
| Samoans | 1.1 /100 | #241 | Tragic 3.3% |
| Yugoslavians | 1.0 /100 | #242 | Tragic 3.3% |
| Immigrants | Western Europe | 1.0 /100 | #243 | Tragic 3.3% |
| Assyrians/Chaldeans/Syriacs | 0.9 /100 | #244 | Tragic 3.3% |
| Immigrants | Scotland | 0.8 /100 | #245 | Tragic 3.3% |
| Immigrants | England | 0.7 /100 | #246 | Tragic 3.3% |
| Lithuanians | 0.6 /100 | #247 | Tragic 3.4% |
| Austrians | 0.6 /100 | #248 | Tragic 3.4% |
| Italians | 0.4 /100 | #249 | Tragic 3.4% |
| Yuman | 0.4 /100 | #250 | Tragic 3.4% |
| Hungarians | 0.4 /100 | #251 | Tragic 3.4% |
| Croatians | 0.4 /100 | #252 | Tragic 3.4% |
| Carpatho Rusyns | 0.3 /100 | #253 | Tragic 3.4% |