Choctaw vs Immigrants from England Hearing Disability
COMPARE
Choctaw
Immigrants from England
Hearing Disability
Hearing Disability Comparison
Choctaw
Immigrants from England
4.5%
HEARING DISABILITY
0.0/ 100
METRIC RATING
339th/ 347
METRIC RANK
3.3%
HEARING DISABILITY
0.7/ 100
METRIC RATING
246th/ 347
METRIC RANK
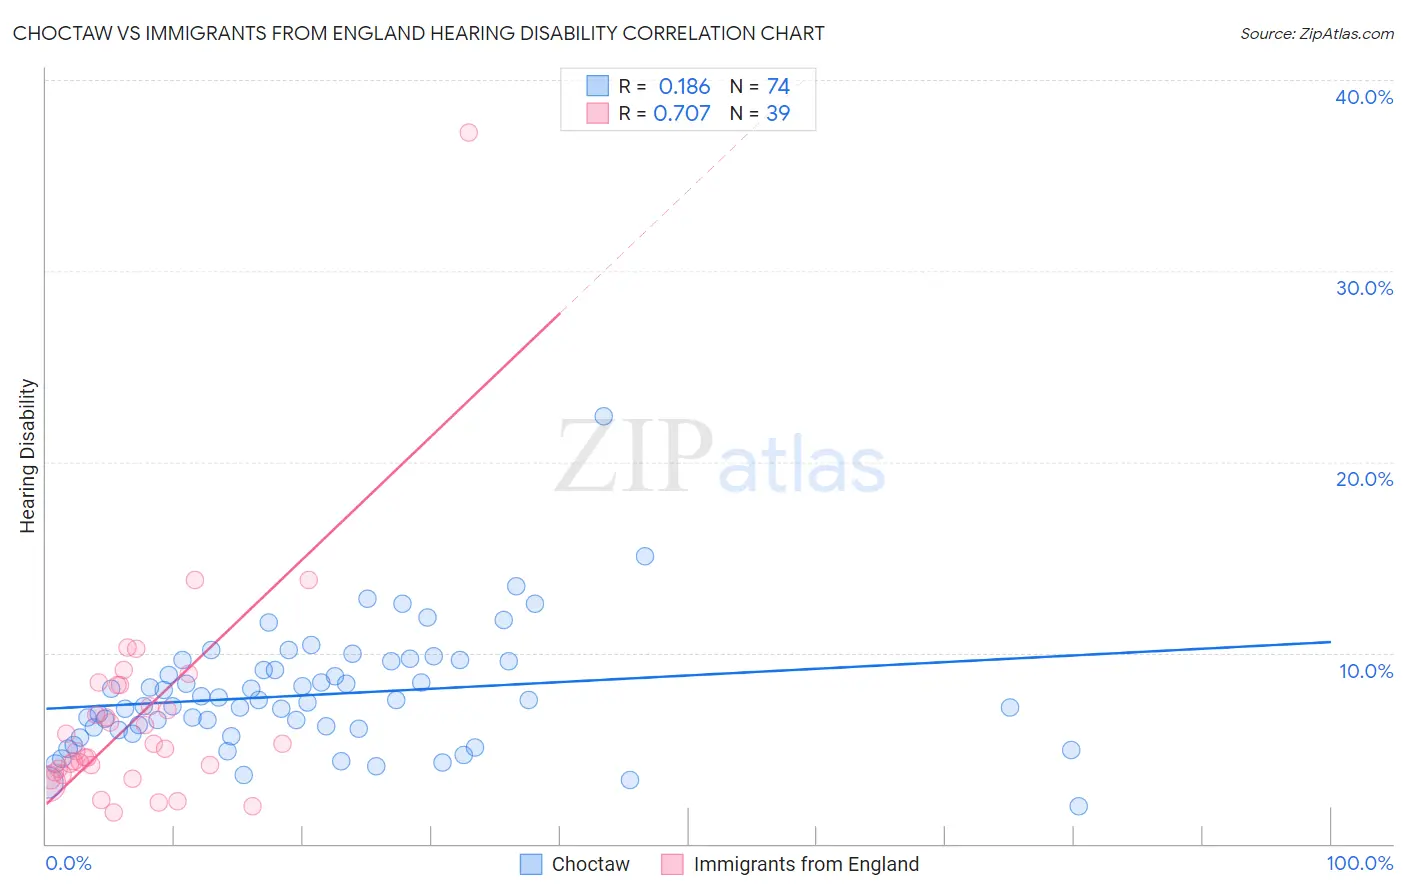
Choctaw vs Immigrants from England Hearing Disability Correlation Chart
The statistical analysis conducted on geographies consisting of 269,646,224 people shows a poor positive correlation between the proportion of Choctaw and percentage of population with hearing disability in the United States with a correlation coefficient (R) of 0.186 and weighted average of 4.5%. Similarly, the statistical analysis conducted on geographies consisting of 391,804,752 people shows a strong positive correlation between the proportion of Immigrants from England and percentage of population with hearing disability in the United States with a correlation coefficient (R) of 0.707 and weighted average of 3.3%, a difference of 36.0%.
Hearing Disability Correlation Summary
| Measurement | Choctaw | Immigrants from England |
| Minimum | 1.9% | 1.6% |
| Maximum | 22.4% | 37.3% |
| Range | 20.4% | 35.7% |
| Mean | 7.8% | 6.6% |
| Median | 7.4% | 5.0% |
| Interquartile 25% (IQ1) | 6.0% | 3.8% |
| Interquartile 75% (IQ3) | 9.5% | 8.3% |
| Interquartile Range (IQR) | 3.6% | 4.5% |
| Standard Deviation (Sample) | 3.1% | 5.9% |
| Standard Deviation (Population) | 3.1% | 5.8% |
Similar Demographics by Hearing Disability
Demographics Similar to Choctaw by Hearing Disability
In terms of hearing disability, the demographic groups most similar to Choctaw are Alaska Native (4.5%, a difference of 1.4%), Pueblo (4.6%, a difference of 1.5%), Chickasaw (4.5%, a difference of 1.6%), Navajo (4.6%, a difference of 1.8%), and Tsimshian (4.7%, a difference of 3.4%).
| Demographics | Rating | Rank | Hearing Disability |
| Houma | 0.0 /100 | #332 | Tragic 4.2% |
| Dutch West Indians | 0.0 /100 | #333 | Tragic 4.3% |
| Aleuts | 0.0 /100 | #334 | Tragic 4.3% |
| Kiowa | 0.0 /100 | #335 | Tragic 4.3% |
| Creek | 0.0 /100 | #336 | Tragic 4.4% |
| Chickasaw | 0.0 /100 | #337 | Tragic 4.5% |
| Alaska Natives | 0.0 /100 | #338 | Tragic 4.5% |
| Choctaw | 0.0 /100 | #339 | Tragic 4.5% |
| Pueblo | 0.0 /100 | #340 | Tragic 4.6% |
| Navajo | 0.0 /100 | #341 | Tragic 4.6% |
| Tsimshian | 0.0 /100 | #342 | Tragic 4.7% |
| Inupiat | 0.0 /100 | #343 | Tragic 4.7% |
| Tlingit-Haida | 0.0 /100 | #344 | Tragic 4.8% |
| Alaskan Athabascans | 0.0 /100 | #345 | Tragic 5.3% |
| Colville | 0.0 /100 | #346 | Tragic 5.3% |
Demographics Similar to Immigrants from England by Hearing Disability
In terms of hearing disability, the demographic groups most similar to Immigrants from England are Lithuanian (3.4%, a difference of 0.20%), Immigrants from Scotland (3.3%, a difference of 0.28%), Austrian (3.4%, a difference of 0.42%), Assyrian/Chaldean/Syriac (3.3%, a difference of 0.62%), and Immigrants from Western Europe (3.3%, a difference of 0.69%).
| Demographics | Rating | Rank | Hearing Disability |
| Nepalese | 1.2 /100 | #239 | Tragic 3.3% |
| Immigrants | Netherlands | 1.1 /100 | #240 | Tragic 3.3% |
| Samoans | 1.1 /100 | #241 | Tragic 3.3% |
| Yugoslavians | 1.0 /100 | #242 | Tragic 3.3% |
| Immigrants | Western Europe | 1.0 /100 | #243 | Tragic 3.3% |
| Assyrians/Chaldeans/Syriacs | 0.9 /100 | #244 | Tragic 3.3% |
| Immigrants | Scotland | 0.8 /100 | #245 | Tragic 3.3% |
| Immigrants | England | 0.7 /100 | #246 | Tragic 3.3% |
| Lithuanians | 0.6 /100 | #247 | Tragic 3.4% |
| Austrians | 0.6 /100 | #248 | Tragic 3.4% |
| Italians | 0.4 /100 | #249 | Tragic 3.4% |
| Yuman | 0.4 /100 | #250 | Tragic 3.4% |
| Hungarians | 0.4 /100 | #251 | Tragic 3.4% |
| Croatians | 0.4 /100 | #252 | Tragic 3.4% |
| Carpatho Rusyns | 0.3 /100 | #253 | Tragic 3.4% |