Immigrants from North America vs Immigrants from England Child Poverty Under the Age of 5
COMPARE
Immigrants from North America
Immigrants from England
Child Poverty Under the Age of 5
Child Poverty Under the Age of 5 Comparison
Immigrants from North America
Immigrants from England
15.9%
CHILD POVERTY UNDER THE AGE OF 5
94.9/ 100
METRIC RATING
104th/ 347
METRIC RANK
16.2%
CHILD POVERTY UNDER THE AGE OF 5
91.5/ 100
METRIC RATING
127th/ 347
METRIC RANK
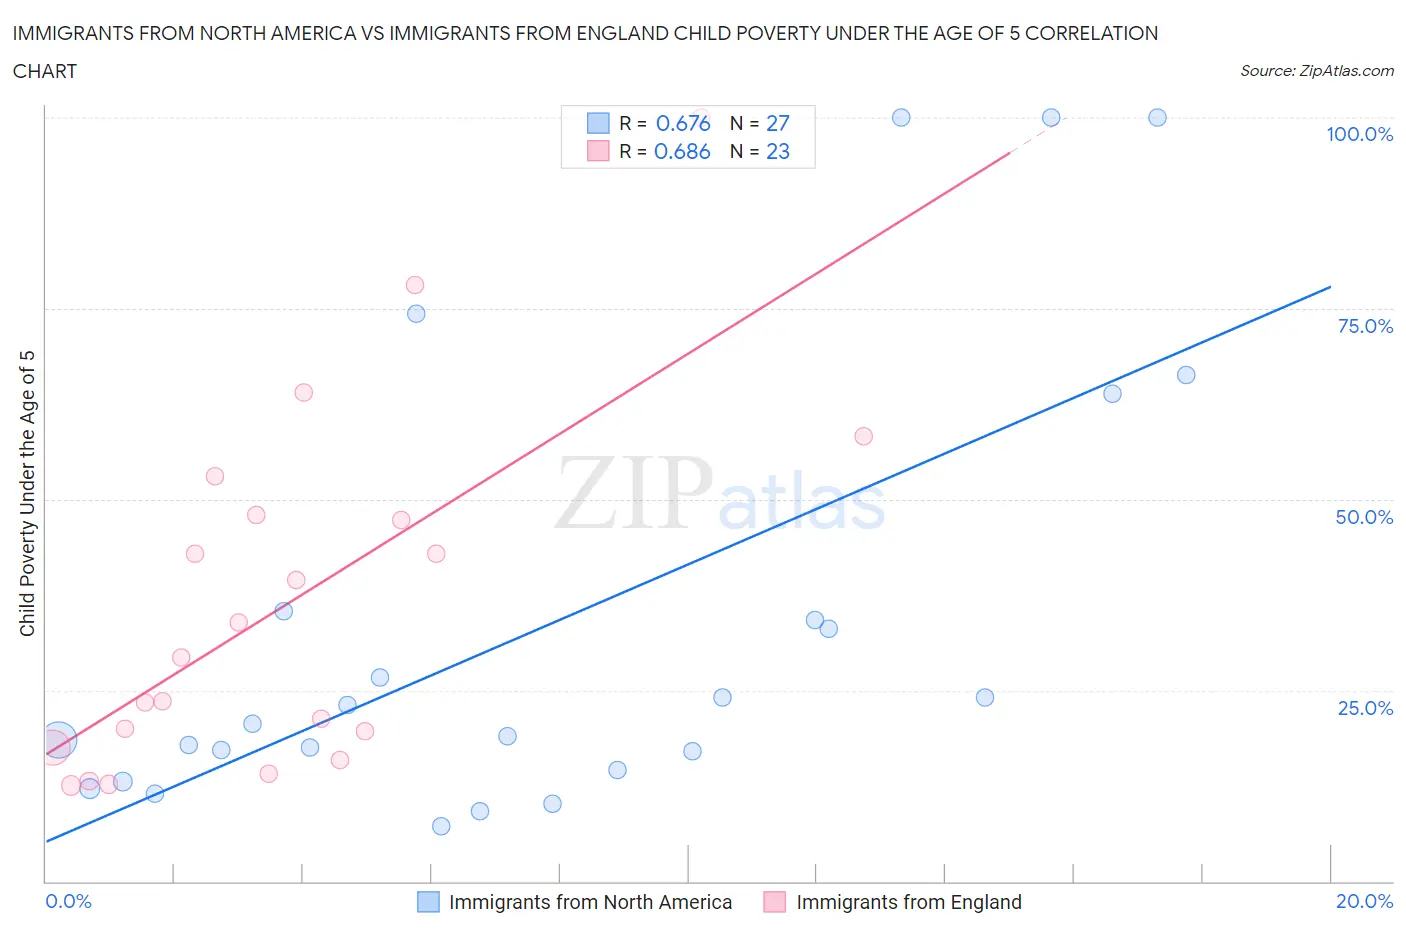
Immigrants from North America vs Immigrants from England Child Poverty Under the Age of 5 Correlation Chart
The statistical analysis conducted on geographies consisting of 437,519,892 people shows a significant positive correlation between the proportion of Immigrants from North America and poverty level among children under the age of 5 in the United States with a correlation coefficient (R) of 0.676 and weighted average of 15.9%. Similarly, the statistical analysis conducted on geographies consisting of 373,543,050 people shows a significant positive correlation between the proportion of Immigrants from England and poverty level among children under the age of 5 in the United States with a correlation coefficient (R) of 0.686 and weighted average of 16.2%, a difference of 1.5%.
Child Poverty Under the Age of 5 Correlation Summary
| Measurement | Immigrants from North America | Immigrants from England |
| Minimum | 7.2% | 12.5% |
| Maximum | 100.0% | 100.0% |
| Range | 92.8% | 87.5% |
| Mean | 33.7% | 36.1% |
| Median | 20.7% | 29.3% |
| Interquartile 25% (IQ1) | 14.6% | 17.6% |
| Interquartile 75% (IQ3) | 35.3% | 48.0% |
| Interquartile Range (IQR) | 20.7% | 30.5% |
| Standard Deviation (Sample) | 29.4% | 23.1% |
| Standard Deviation (Population) | 28.8% | 22.6% |
Similar Demographics by Child Poverty Under the Age of 5
Demographics Similar to Immigrants from North America by Child Poverty Under the Age of 5
In terms of child poverty under the age of 5, the demographic groups most similar to Immigrants from North America are Immigrants from Spain (15.9%, a difference of 0.080%), Tlingit-Haida (15.9%, a difference of 0.12%), European (15.9%, a difference of 0.21%), Slovene (16.0%, a difference of 0.27%), and Immigrants from Brazil (16.0%, a difference of 0.28%).
| Demographics | Rating | Rank | Child Poverty Under the Age of 5 |
| Macedonians | 96.2 /100 | #97 | Exceptional 15.8% |
| Immigrants | South Africa | 96.1 /100 | #98 | Exceptional 15.8% |
| Palestinians | 95.9 /100 | #99 | Exceptional 15.8% |
| Immigrants | Canada | 95.9 /100 | #100 | Exceptional 15.8% |
| Immigrants | Zimbabwe | 95.9 /100 | #101 | Exceptional 15.8% |
| Armenians | 95.7 /100 | #102 | Exceptional 15.8% |
| Europeans | 95.3 /100 | #103 | Exceptional 15.9% |
| Immigrants | North America | 94.9 /100 | #104 | Exceptional 15.9% |
| Immigrants | Spain | 94.8 /100 | #105 | Exceptional 15.9% |
| Tlingit-Haida | 94.7 /100 | #106 | Exceptional 15.9% |
| Slovenes | 94.4 /100 | #107 | Exceptional 16.0% |
| Immigrants | Brazil | 94.4 /100 | #108 | Exceptional 16.0% |
| Northern Europeans | 94.3 /100 | #109 | Exceptional 16.0% |
| Romanians | 94.3 /100 | #110 | Exceptional 16.0% |
| Pakistanis | 94.2 /100 | #111 | Exceptional 16.0% |
Demographics Similar to Immigrants from England by Child Poverty Under the Age of 5
In terms of child poverty under the age of 5, the demographic groups most similar to Immigrants from England are Immigrants from Albania (16.2%, a difference of 0.080%), Native Hawaiian (16.2%, a difference of 0.090%), Swiss (16.1%, a difference of 0.16%), Austrian (16.1%, a difference of 0.17%), and Immigrants from Southern Europe (16.1%, a difference of 0.19%).
| Demographics | Rating | Rank | Child Poverty Under the Age of 5 |
| Immigrants | Peru | 92.6 /100 | #120 | Exceptional 16.1% |
| Mongolians | 92.5 /100 | #121 | Exceptional 16.1% |
| Immigrants | Southern Europe | 92.0 /100 | #122 | Exceptional 16.1% |
| Austrians | 92.0 /100 | #123 | Exceptional 16.1% |
| Swiss | 92.0 /100 | #124 | Exceptional 16.1% |
| Native Hawaiians | 91.8 /100 | #125 | Exceptional 16.2% |
| Immigrants | Albania | 91.8 /100 | #126 | Exceptional 16.2% |
| Immigrants | England | 91.5 /100 | #127 | Exceptional 16.2% |
| South Africans | 90.1 /100 | #128 | Exceptional 16.2% |
| British | 89.4 /100 | #129 | Excellent 16.3% |
| Immigrants | Norway | 89.3 /100 | #130 | Excellent 16.3% |
| Finns | 88.3 /100 | #131 | Excellent 16.3% |
| Serbians | 88.2 /100 | #132 | Excellent 16.3% |
| Icelanders | 87.9 /100 | #133 | Excellent 16.3% |
| Immigrants | North Macedonia | 87.8 /100 | #134 | Excellent 16.4% |