Peruvian vs Immigrants from England Hearing Disability
COMPARE
Peruvian
Immigrants from England
Hearing Disability
Hearing Disability Comparison
Peruvians
Immigrants from England
2.7%
HEARING DISABILITY
97.7/ 100
METRIC RATING
70th/ 347
METRIC RANK
3.3%
HEARING DISABILITY
0.7/ 100
METRIC RATING
246th/ 347
METRIC RANK
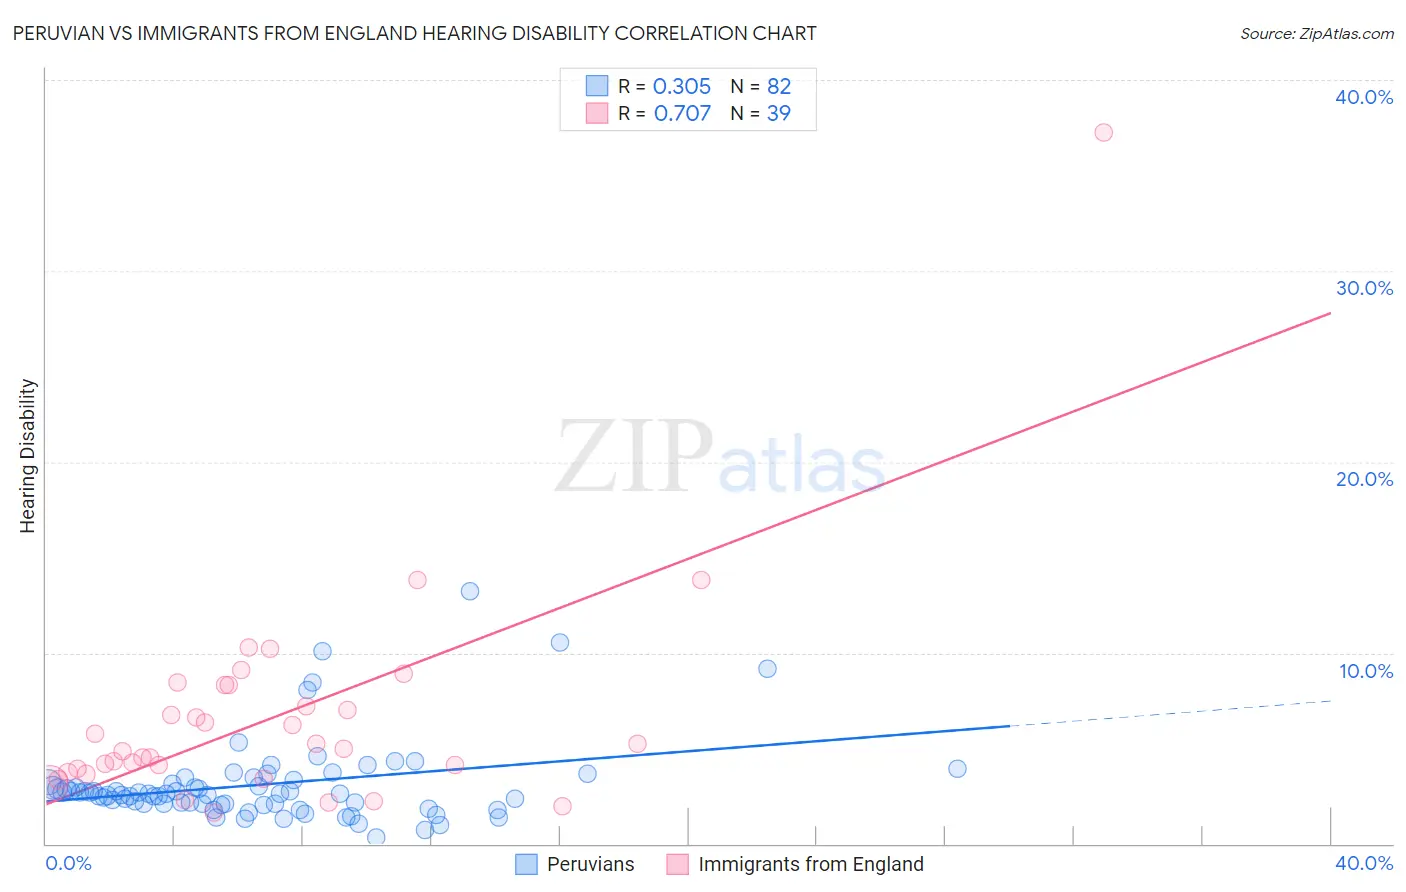
Peruvian vs Immigrants from England Hearing Disability Correlation Chart
The statistical analysis conducted on geographies consisting of 363,103,364 people shows a mild positive correlation between the proportion of Peruvians and percentage of population with hearing disability in the United States with a correlation coefficient (R) of 0.305 and weighted average of 2.7%. Similarly, the statistical analysis conducted on geographies consisting of 391,804,752 people shows a strong positive correlation between the proportion of Immigrants from England and percentage of population with hearing disability in the United States with a correlation coefficient (R) of 0.707 and weighted average of 3.3%, a difference of 22.5%.
Hearing Disability Correlation Summary
| Measurement | Peruvian | Immigrants from England |
| Minimum | 0.31% | 1.6% |
| Maximum | 13.2% | 37.3% |
| Range | 12.9% | 35.7% |
| Mean | 3.1% | 6.6% |
| Median | 2.6% | 5.0% |
| Interquartile 25% (IQ1) | 2.1% | 3.8% |
| Interquartile 75% (IQ3) | 3.2% | 8.3% |
| Interquartile Range (IQR) | 1.2% | 4.5% |
| Standard Deviation (Sample) | 2.2% | 5.9% |
| Standard Deviation (Population) | 2.2% | 5.8% |
Similar Demographics by Hearing Disability
Demographics Similar to Peruvians by Hearing Disability
In terms of hearing disability, the demographic groups most similar to Peruvians are Central American (2.7%, a difference of 0.050%), Afghan (2.7%, a difference of 0.15%), Nicaraguan (2.7%, a difference of 0.23%), Argentinean (2.7%, a difference of 0.23%), and Immigrants from Korea (2.7%, a difference of 0.23%).
| Demographics | Rating | Rank | Hearing Disability |
| Indians (Asian) | 98.4 /100 | #63 | Exceptional 2.7% |
| Immigrants | Sri Lanka | 98.4 /100 | #64 | Exceptional 2.7% |
| Immigrants | Nepal | 98.3 /100 | #65 | Exceptional 2.7% |
| Immigrants | Belize | 98.2 /100 | #66 | Exceptional 2.7% |
| Egyptians | 98.1 /100 | #67 | Exceptional 2.7% |
| Immigrants | Africa | 98.0 /100 | #68 | Exceptional 2.7% |
| Nicaraguans | 97.9 /100 | #69 | Exceptional 2.7% |
| Peruvians | 97.7 /100 | #70 | Exceptional 2.7% |
| Central Americans | 97.7 /100 | #71 | Exceptional 2.7% |
| Afghans | 97.6 /100 | #72 | Exceptional 2.7% |
| Argentineans | 97.5 /100 | #73 | Exceptional 2.7% |
| Immigrants | Korea | 97.5 /100 | #74 | Exceptional 2.7% |
| Immigrants | Saudi Arabia | 97.5 /100 | #75 | Exceptional 2.7% |
| Asians | 97.5 /100 | #76 | Exceptional 2.7% |
| Immigrants | Malaysia | 97.5 /100 | #77 | Exceptional 2.7% |
Demographics Similar to Immigrants from England by Hearing Disability
In terms of hearing disability, the demographic groups most similar to Immigrants from England are Lithuanian (3.4%, a difference of 0.20%), Immigrants from Scotland (3.3%, a difference of 0.28%), Austrian (3.4%, a difference of 0.42%), Assyrian/Chaldean/Syriac (3.3%, a difference of 0.62%), and Immigrants from Western Europe (3.3%, a difference of 0.69%).
| Demographics | Rating | Rank | Hearing Disability |
| Nepalese | 1.2 /100 | #239 | Tragic 3.3% |
| Immigrants | Netherlands | 1.1 /100 | #240 | Tragic 3.3% |
| Samoans | 1.1 /100 | #241 | Tragic 3.3% |
| Yugoslavians | 1.0 /100 | #242 | Tragic 3.3% |
| Immigrants | Western Europe | 1.0 /100 | #243 | Tragic 3.3% |
| Assyrians/Chaldeans/Syriacs | 0.9 /100 | #244 | Tragic 3.3% |
| Immigrants | Scotland | 0.8 /100 | #245 | Tragic 3.3% |
| Immigrants | England | 0.7 /100 | #246 | Tragic 3.3% |
| Lithuanians | 0.6 /100 | #247 | Tragic 3.4% |
| Austrians | 0.6 /100 | #248 | Tragic 3.4% |
| Italians | 0.4 /100 | #249 | Tragic 3.4% |
| Yuman | 0.4 /100 | #250 | Tragic 3.4% |
| Hungarians | 0.4 /100 | #251 | Tragic 3.4% |
| Croatians | 0.4 /100 | #252 | Tragic 3.4% |
| Carpatho Rusyns | 0.3 /100 | #253 | Tragic 3.4% |