Immigrants from Nepal vs Immigrants from Sri Lanka Disability
COMPARE
Immigrants from Nepal
Immigrants from Sri Lanka
Disability
Disability Comparison
Immigrants from Nepal
Immigrants from Sri Lanka
10.8%
DISABILITY
99.9/ 100
METRIC RATING
42nd/ 347
METRIC RANK
10.5%
DISABILITY
100.0/ 100
METRIC RATING
22nd/ 347
METRIC RANK
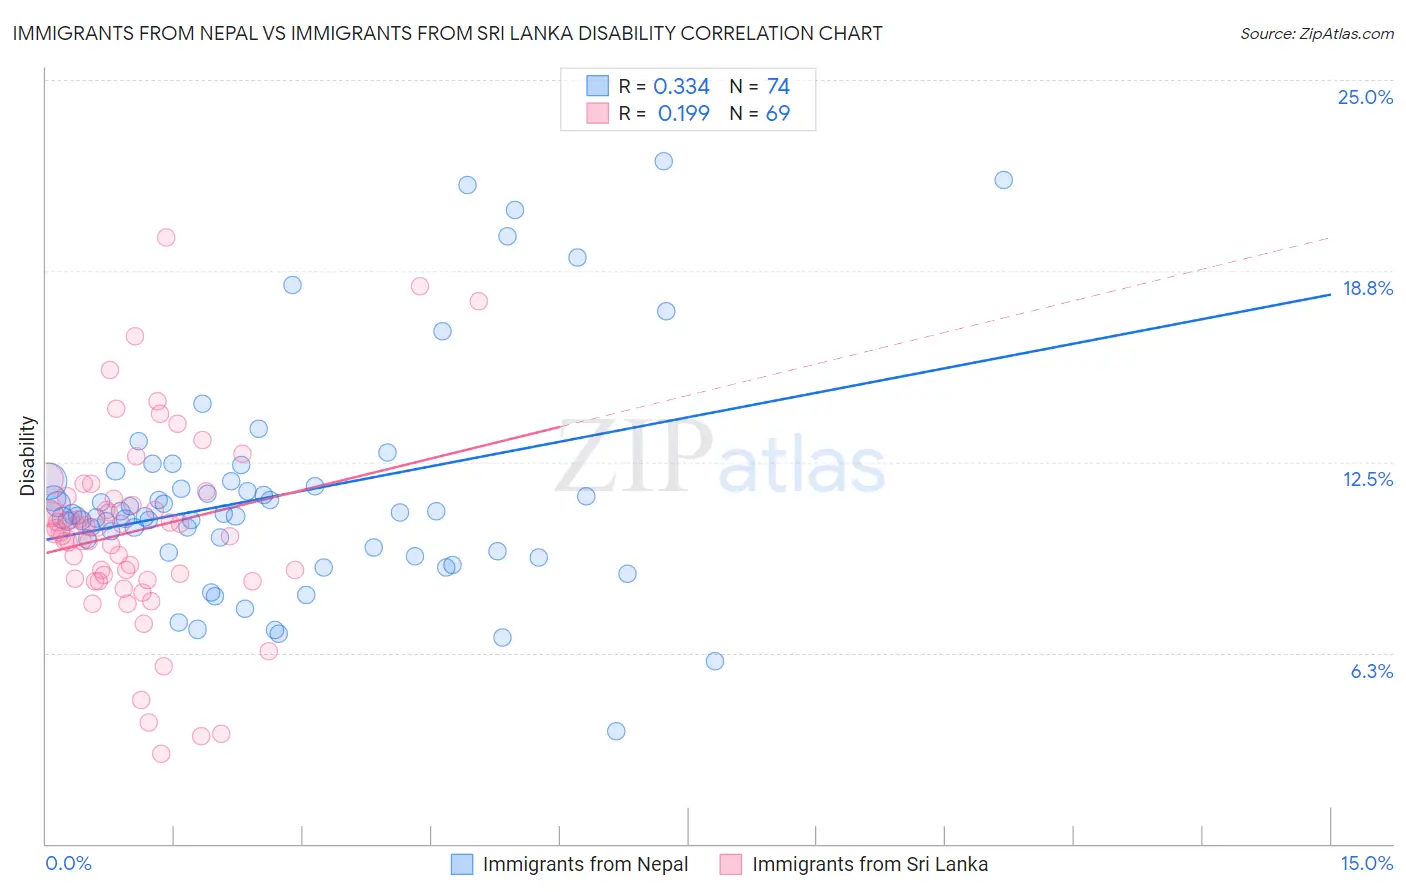
Immigrants from Nepal vs Immigrants from Sri Lanka Disability Correlation Chart
The statistical analysis conducted on geographies consisting of 186,790,977 people shows a mild positive correlation between the proportion of Immigrants from Nepal and percentage of population with a disability in the United States with a correlation coefficient (R) of 0.334 and weighted average of 10.8%. Similarly, the statistical analysis conducted on geographies consisting of 149,700,552 people shows a poor positive correlation between the proportion of Immigrants from Sri Lanka and percentage of population with a disability in the United States with a correlation coefficient (R) of 0.199 and weighted average of 10.5%, a difference of 3.1%.
Disability Correlation Summary
| Measurement | Immigrants from Nepal | Immigrants from Sri Lanka |
| Minimum | 3.7% | 2.9% |
| Maximum | 22.3% | 19.8% |
| Range | 18.7% | 16.9% |
| Mean | 11.4% | 10.2% |
| Median | 10.8% | 10.2% |
| Interquartile 25% (IQ1) | 9.6% | 8.7% |
| Interquartile 75% (IQ3) | 11.9% | 11.3% |
| Interquartile Range (IQR) | 2.3% | 2.7% |
| Standard Deviation (Sample) | 3.7% | 3.2% |
| Standard Deviation (Population) | 3.6% | 3.2% |
Demographics Similar to Immigrants from Nepal and Immigrants from Sri Lanka by Disability
In terms of disability, the demographic groups most similar to Immigrants from Nepal are Immigrants from Australia (10.8%, a difference of 0.10%), Cambodian (10.8%, a difference of 0.14%), Mongolian (10.8%, a difference of 0.14%), Afghan (10.8%, a difference of 0.25%), and Turkish (10.7%, a difference of 0.68%). Similarly, the demographic groups most similar to Immigrants from Sri Lanka are Immigrants from Asia (10.5%, a difference of 0.69%), Venezuelan (10.5%, a difference of 0.84%), Immigrants from Malaysia (10.6%, a difference of 1.2%), Argentinean (10.6%, a difference of 1.3%), and Cypriot (10.6%, a difference of 1.3%).
| Demographics | Rating | Rank | Disability |
| Immigrants | Sri Lanka | 100.0 /100 | #22 | Exceptional 10.5% |
| Immigrants | Asia | 100.0 /100 | #23 | Exceptional 10.5% |
| Venezuelans | 100.0 /100 | #24 | Exceptional 10.5% |
| Immigrants | Malaysia | 100.0 /100 | #25 | Exceptional 10.6% |
| Argentineans | 100.0 /100 | #26 | Exceptional 10.6% |
| Cypriots | 100.0 /100 | #27 | Exceptional 10.6% |
| Egyptians | 100.0 /100 | #28 | Exceptional 10.6% |
| Immigrants | Argentina | 100.0 /100 | #29 | Exceptional 10.6% |
| Immigrants | Turkey | 100.0 /100 | #30 | Exceptional 10.6% |
| Immigrants | Egypt | 100.0 /100 | #31 | Exceptional 10.6% |
| Paraguayans | 100.0 /100 | #32 | Exceptional 10.6% |
| Immigrants | Kuwait | 100.0 /100 | #33 | Exceptional 10.7% |
| Immigrants | Ethiopia | 100.0 /100 | #34 | Exceptional 10.7% |
| Immigrants | Indonesia | 100.0 /100 | #35 | Exceptional 10.7% |
| Ethiopians | 100.0 /100 | #36 | Exceptional 10.7% |
| Turks | 100.0 /100 | #37 | Exceptional 10.7% |
| Afghans | 99.9 /100 | #38 | Exceptional 10.8% |
| Cambodians | 99.9 /100 | #39 | Exceptional 10.8% |
| Mongolians | 99.9 /100 | #40 | Exceptional 10.8% |
| Immigrants | Australia | 99.9 /100 | #41 | Exceptional 10.8% |
| Immigrants | Nepal | 99.9 /100 | #42 | Exceptional 10.8% |