Immigrants from Nepal vs Blackfeet Disability Age Under 5
COMPARE
Immigrants from Nepal
Blackfeet
Disability Age Under 5
Disability Age Under 5 Comparison
Immigrants from Nepal
Blackfeet
1.0%
DISABILITY AGE UNDER 5
99.9/ 100
METRIC RATING
36th/ 347
METRIC RANK
1.6%
DISABILITY AGE UNDER 5
0.0/ 100
METRIC RATING
305th/ 347
METRIC RANK
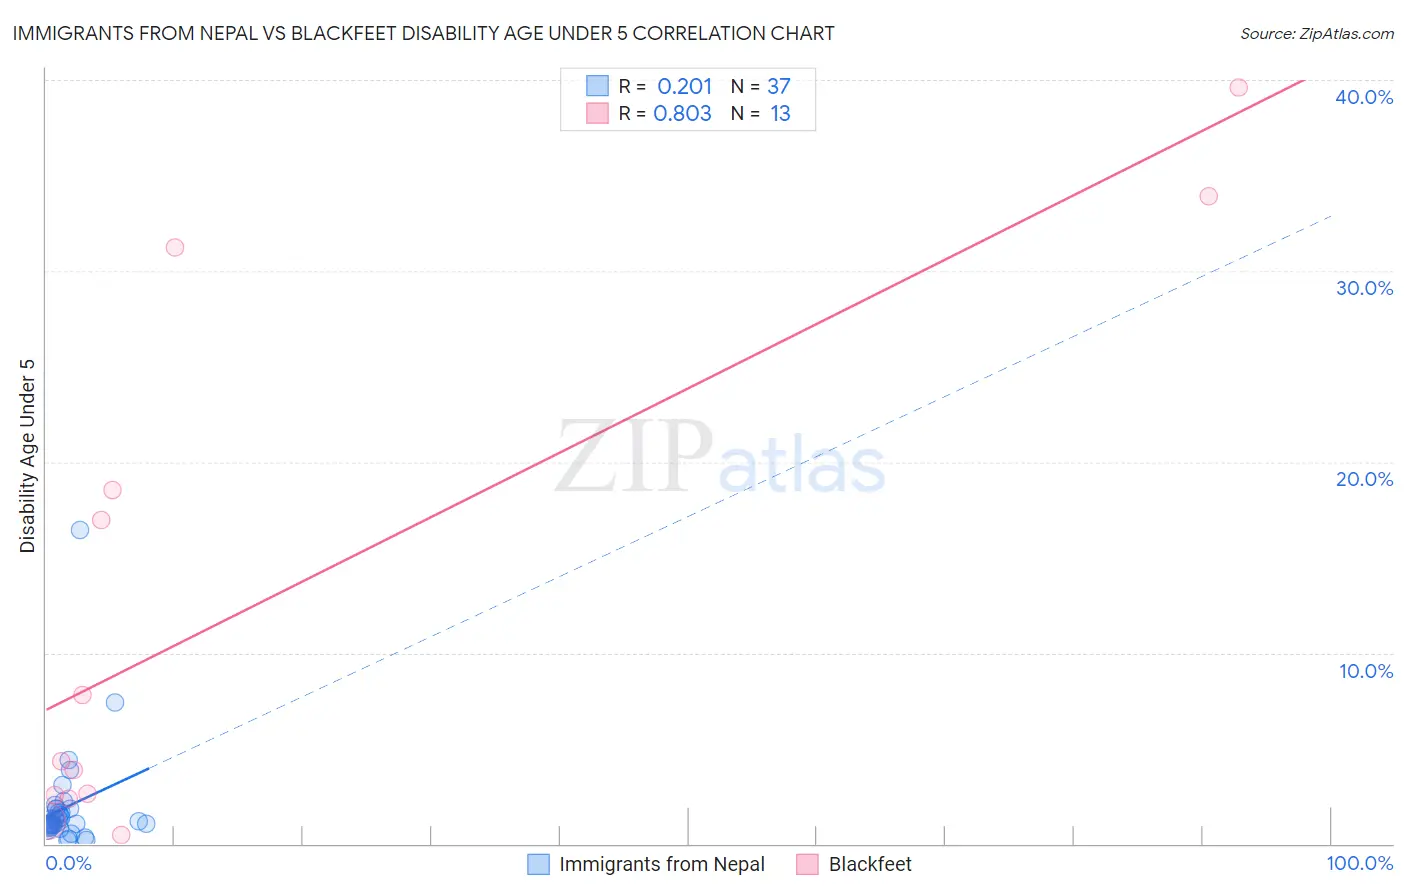
Immigrants from Nepal vs Blackfeet Disability Age Under 5 Correlation Chart
The statistical analysis conducted on geographies consisting of 121,153,865 people shows a weak positive correlation between the proportion of Immigrants from Nepal and percentage of population with a disability under the age of 5 in the United States with a correlation coefficient (R) of 0.201 and weighted average of 1.0%. Similarly, the statistical analysis conducted on geographies consisting of 184,518,312 people shows a very strong positive correlation between the proportion of Blackfeet and percentage of population with a disability under the age of 5 in the United States with a correlation coefficient (R) of 0.803 and weighted average of 1.6%, a difference of 57.6%.
Disability Age Under 5 Correlation Summary
| Measurement | Immigrants from Nepal | Blackfeet |
| Minimum | 0.17% | 0.46% |
| Maximum | 16.5% | 39.6% |
| Range | 16.3% | 39.1% |
| Mean | 1.9% | 12.7% |
| Median | 1.1% | 4.4% |
| Interquartile 25% (IQ1) | 0.92% | 2.4% |
| Interquartile 75% (IQ3) | 1.8% | 24.9% |
| Interquartile Range (IQR) | 0.92% | 22.5% |
| Standard Deviation (Sample) | 2.8% | 14.0% |
| Standard Deviation (Population) | 2.8% | 13.4% |
Similar Demographics by Disability Age Under 5
Demographics Similar to Immigrants from Nepal by Disability Age Under 5
In terms of disability age under 5, the demographic groups most similar to Immigrants from Nepal are Immigrants from India (1.0%, a difference of 0.020%), Immigrants from Guyana (1.0%, a difference of 0.11%), Barbadian (1.0%, a difference of 0.71%), Filipino (1.1%, a difference of 0.78%), and Immigrants from Ukraine (1.0%, a difference of 0.95%).
| Demographics | Rating | Rank | Disability Age Under 5 |
| Immigrants | Belarus | 100.0 /100 | #29 | Exceptional 1.0% |
| Immigrants | South Central Asia | 99.9 /100 | #30 | Exceptional 1.0% |
| Armenians | 99.9 /100 | #31 | Exceptional 1.0% |
| Iranians | 99.9 /100 | #32 | Exceptional 1.0% |
| Bolivians | 99.9 /100 | #33 | Exceptional 1.0% |
| Immigrants | Ukraine | 99.9 /100 | #34 | Exceptional 1.0% |
| Barbadians | 99.9 /100 | #35 | Exceptional 1.0% |
| Immigrants | Nepal | 99.9 /100 | #36 | Exceptional 1.0% |
| Immigrants | India | 99.9 /100 | #37 | Exceptional 1.0% |
| Immigrants | Guyana | 99.9 /100 | #38 | Exceptional 1.0% |
| Filipinos | 99.9 /100 | #39 | Exceptional 1.1% |
| Immigrants | Albania | 99.9 /100 | #40 | Exceptional 1.1% |
| Thais | 99.8 /100 | #41 | Exceptional 1.1% |
| Immigrants | Bulgaria | 99.8 /100 | #42 | Exceptional 1.1% |
| Pima | 99.8 /100 | #43 | Exceptional 1.1% |
Demographics Similar to Blackfeet by Disability Age Under 5
In terms of disability age under 5, the demographic groups most similar to Blackfeet are Creek (1.6%, a difference of 0.040%), Scottish (1.6%, a difference of 0.10%), Seminole (1.6%, a difference of 0.16%), Navajo (1.6%, a difference of 0.25%), and Swiss (1.6%, a difference of 0.79%).
| Demographics | Rating | Rank | Disability Age Under 5 |
| Cajuns | 0.0 /100 | #298 | Tragic 1.6% |
| Portuguese | 0.0 /100 | #299 | Tragic 1.6% |
| Shoshone | 0.0 /100 | #300 | Tragic 1.6% |
| German Russians | 0.0 /100 | #301 | Tragic 1.6% |
| Welsh | 0.0 /100 | #302 | Tragic 1.6% |
| Swiss | 0.0 /100 | #303 | Tragic 1.6% |
| Seminole | 0.0 /100 | #304 | Tragic 1.6% |
| Blackfeet | 0.0 /100 | #305 | Tragic 1.6% |
| Creek | 0.0 /100 | #306 | Tragic 1.6% |
| Scottish | 0.0 /100 | #307 | Tragic 1.6% |
| Navajo | 0.0 /100 | #308 | Tragic 1.6% |
| Cape Verdeans | 0.0 /100 | #309 | Tragic 1.7% |
| Whites/Caucasians | 0.0 /100 | #310 | Tragic 1.7% |
| English | 0.0 /100 | #311 | Tragic 1.7% |
| Puerto Ricans | 0.0 /100 | #312 | Tragic 1.7% |